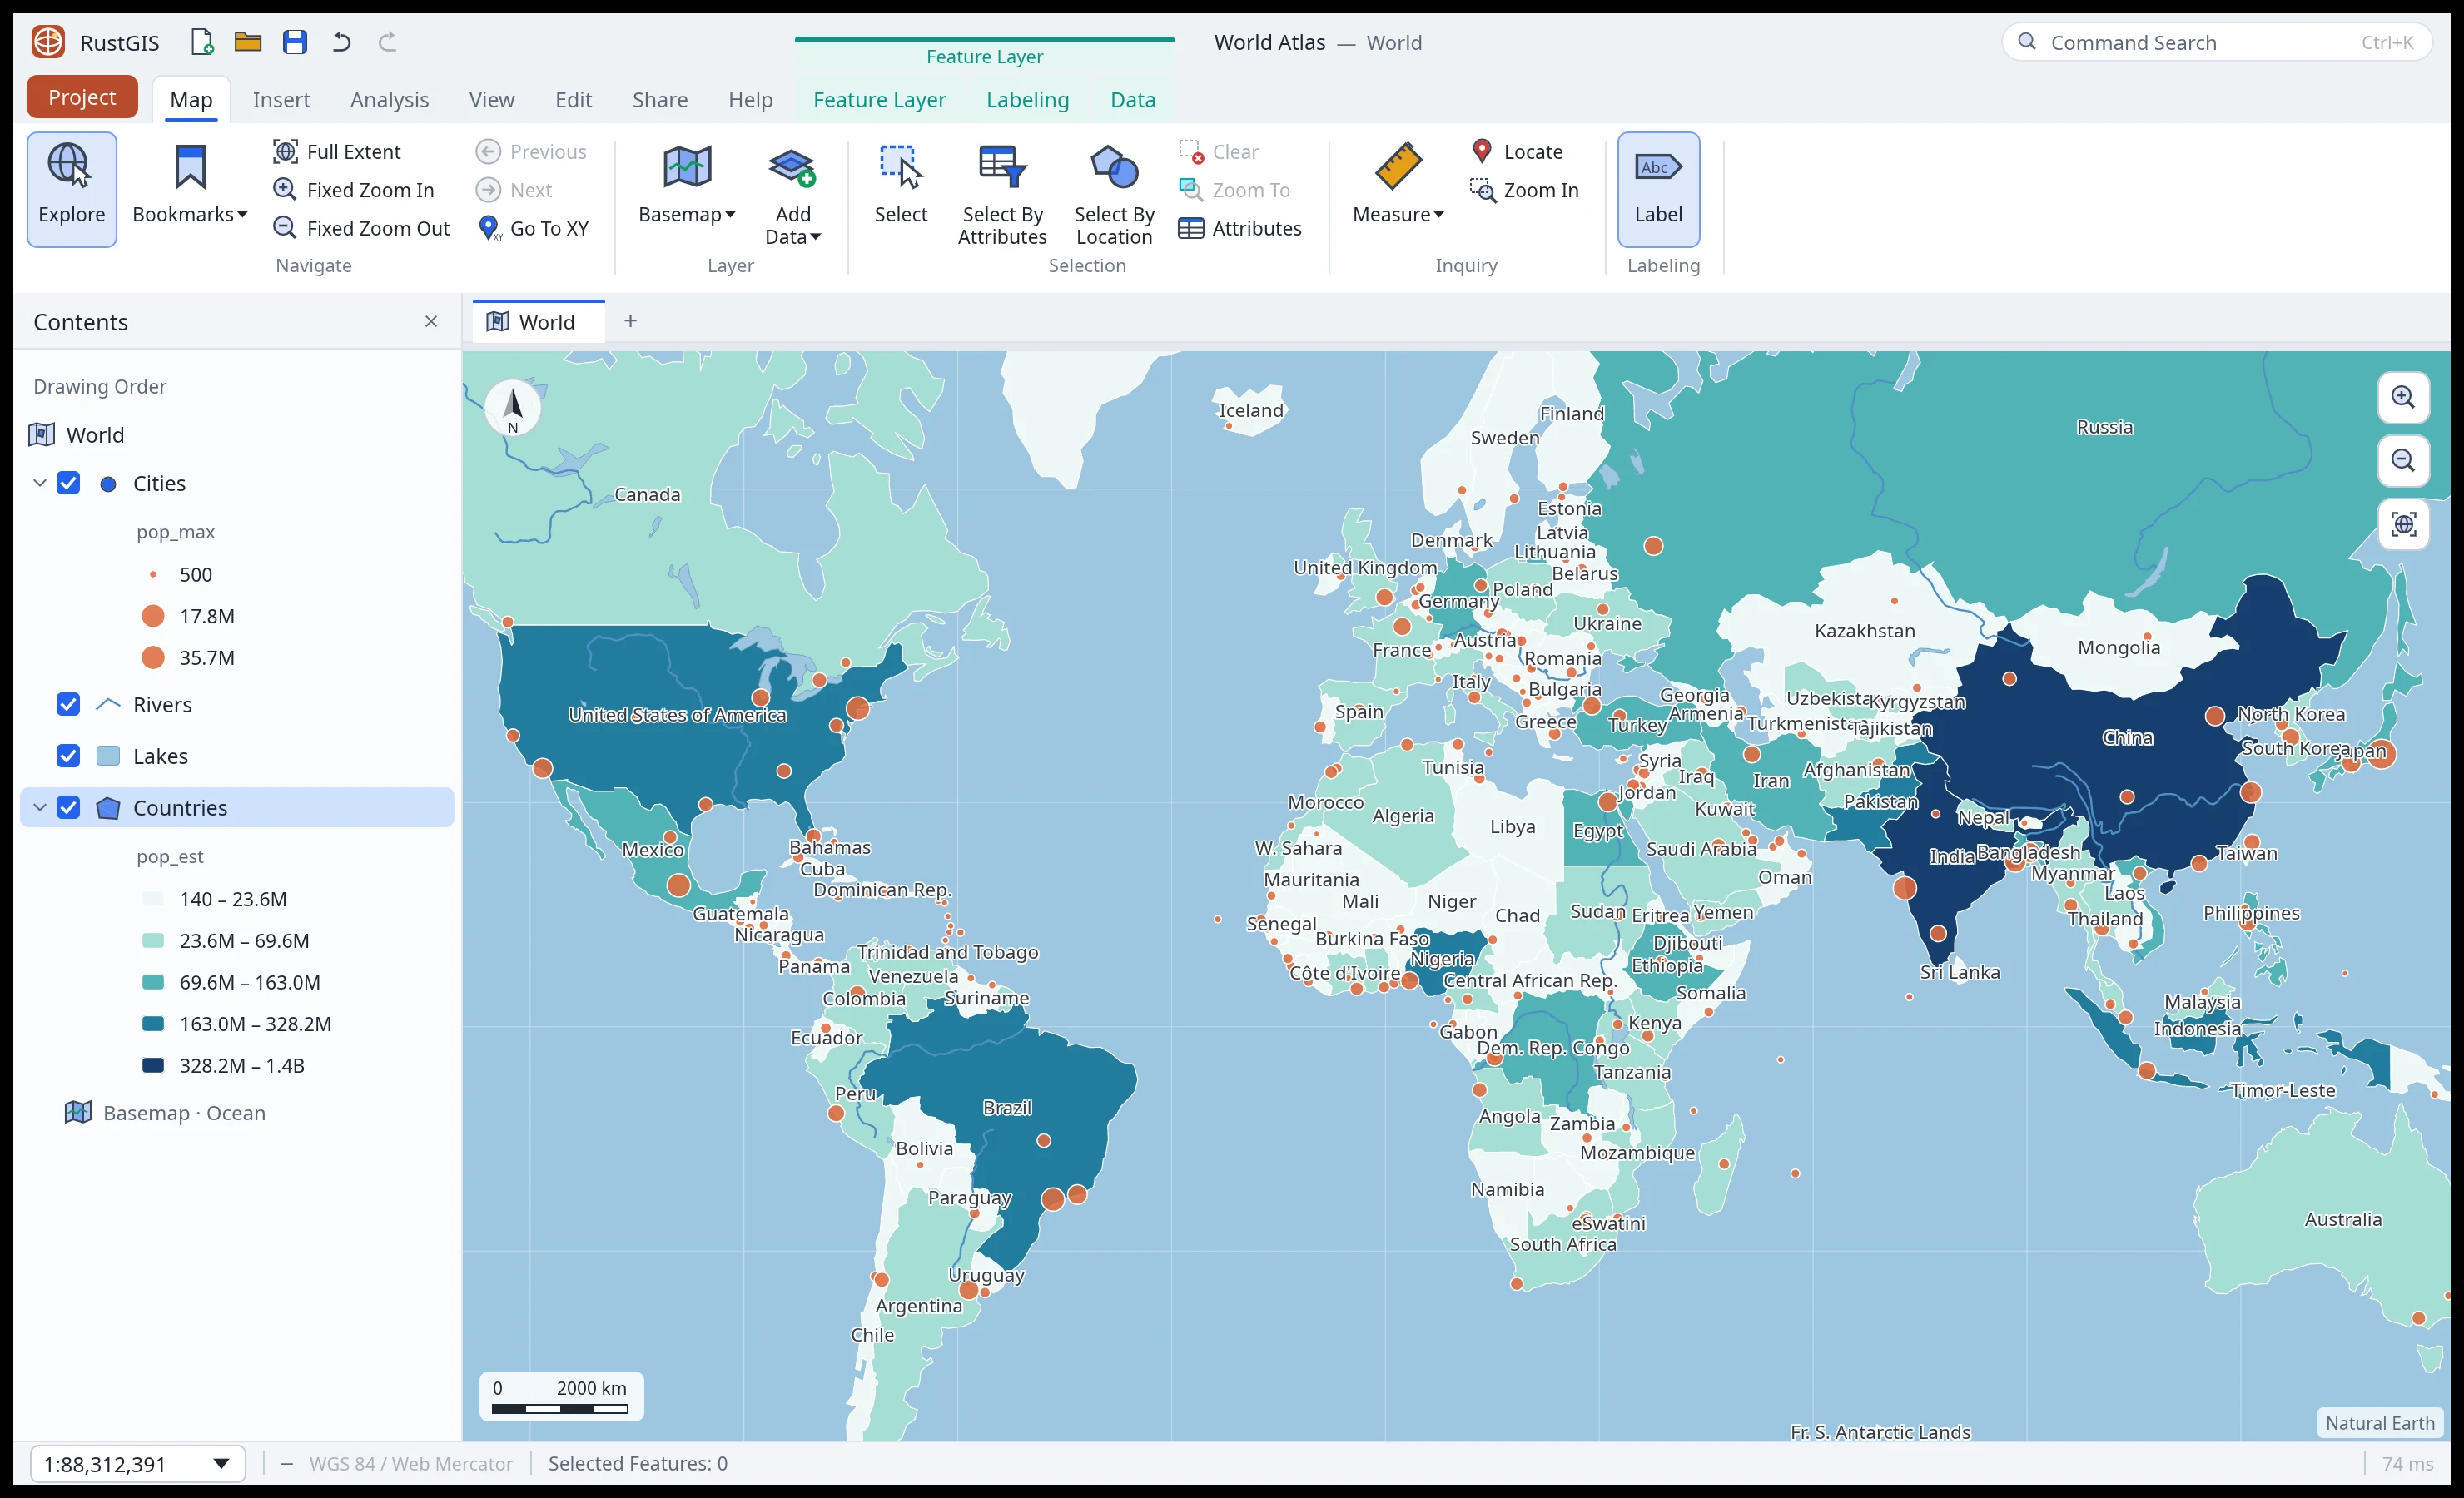
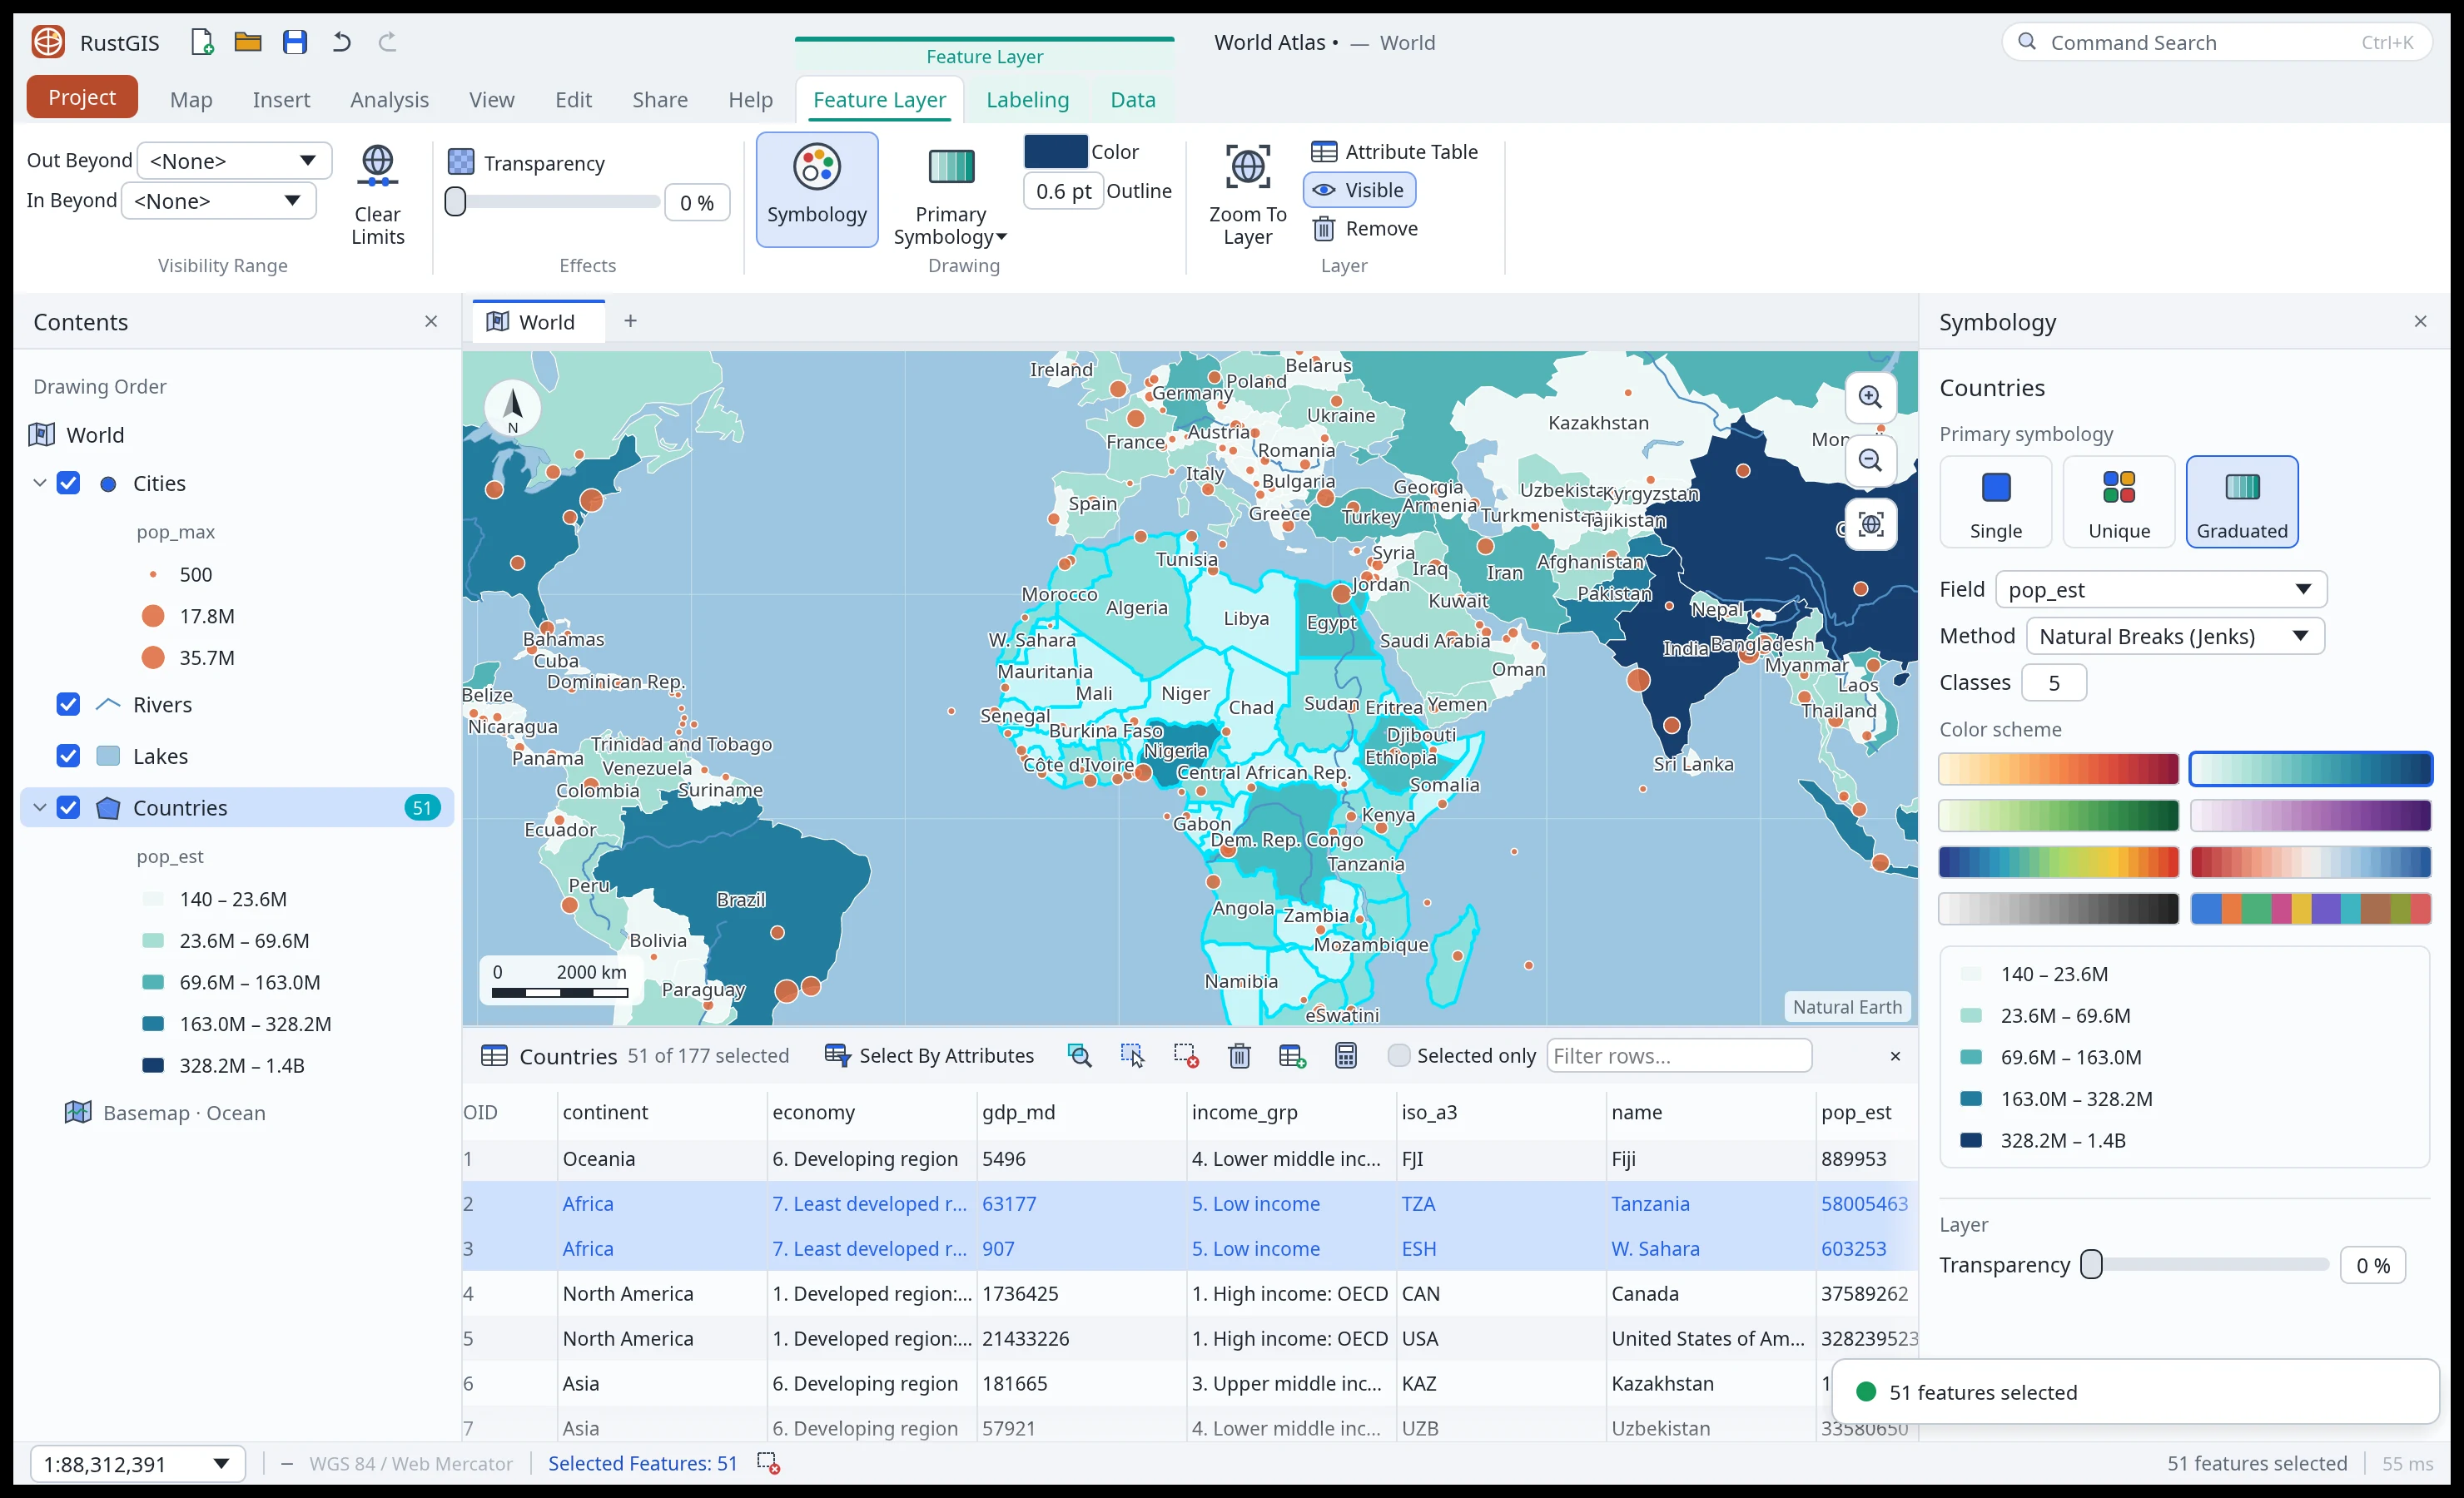
 Symbology and tables. Graduated colours, with the selection synced to the table. |
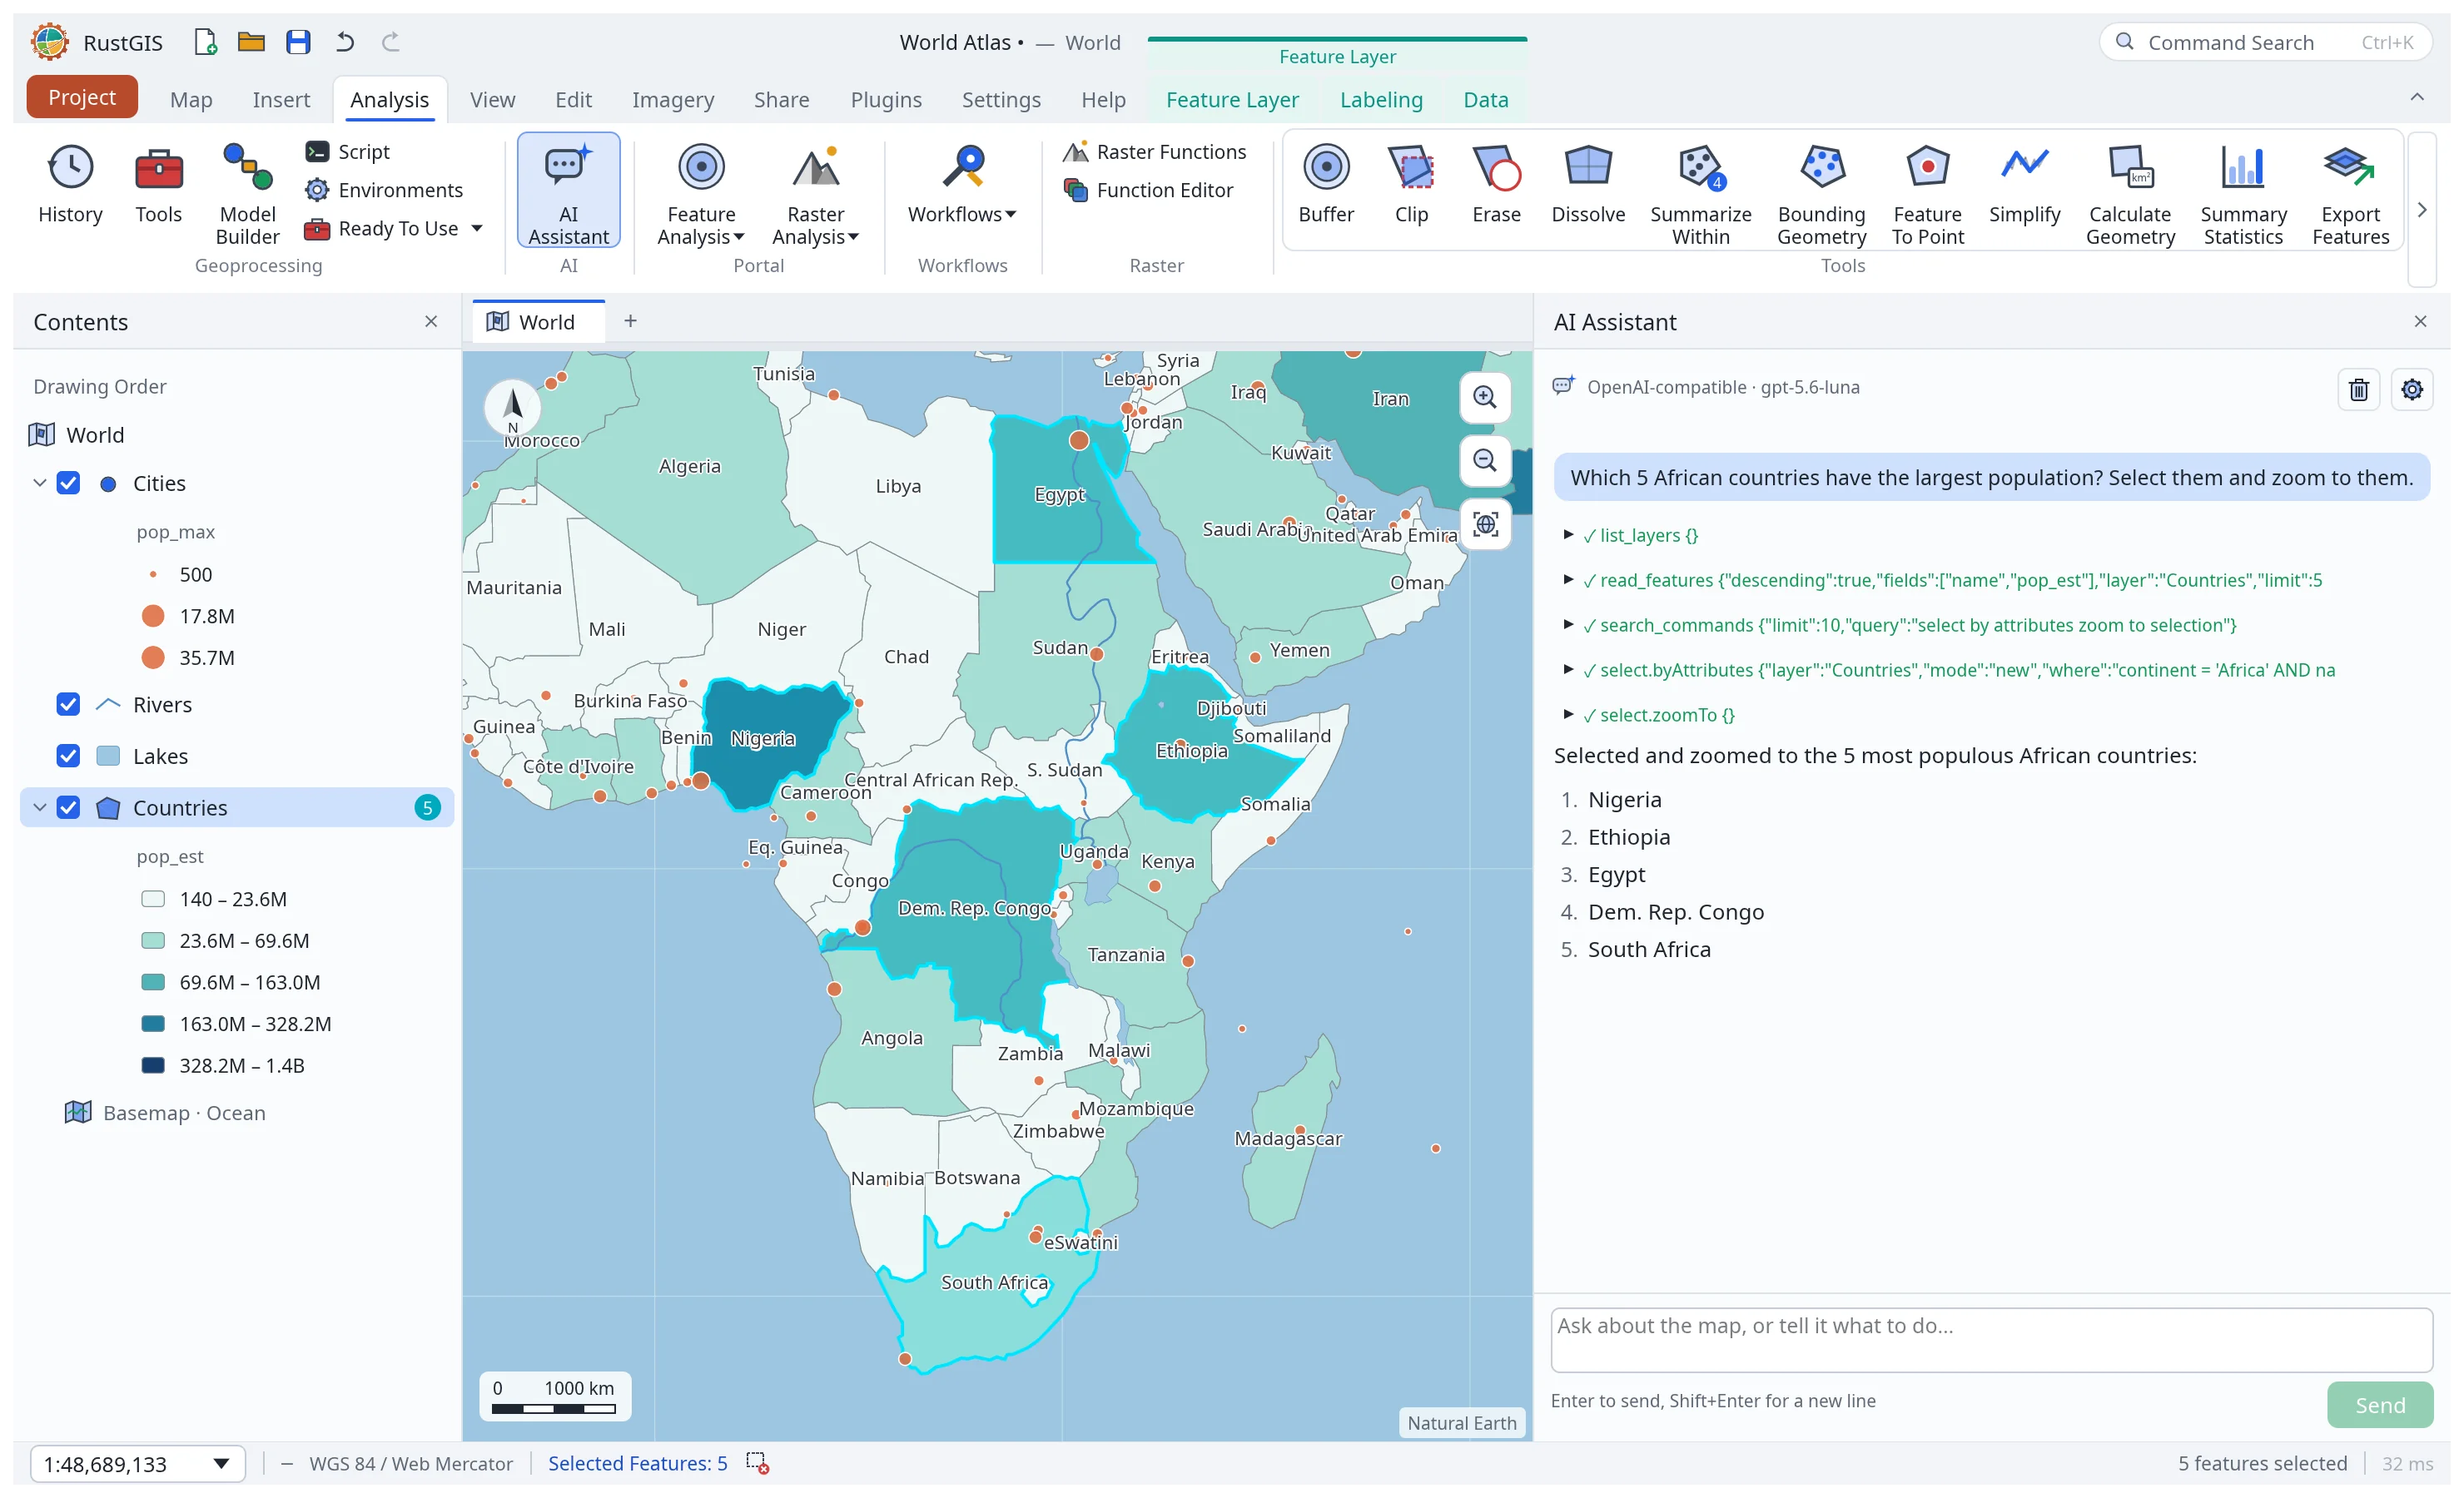 AI Assistant. Ask about your data or tell the map what to do. |
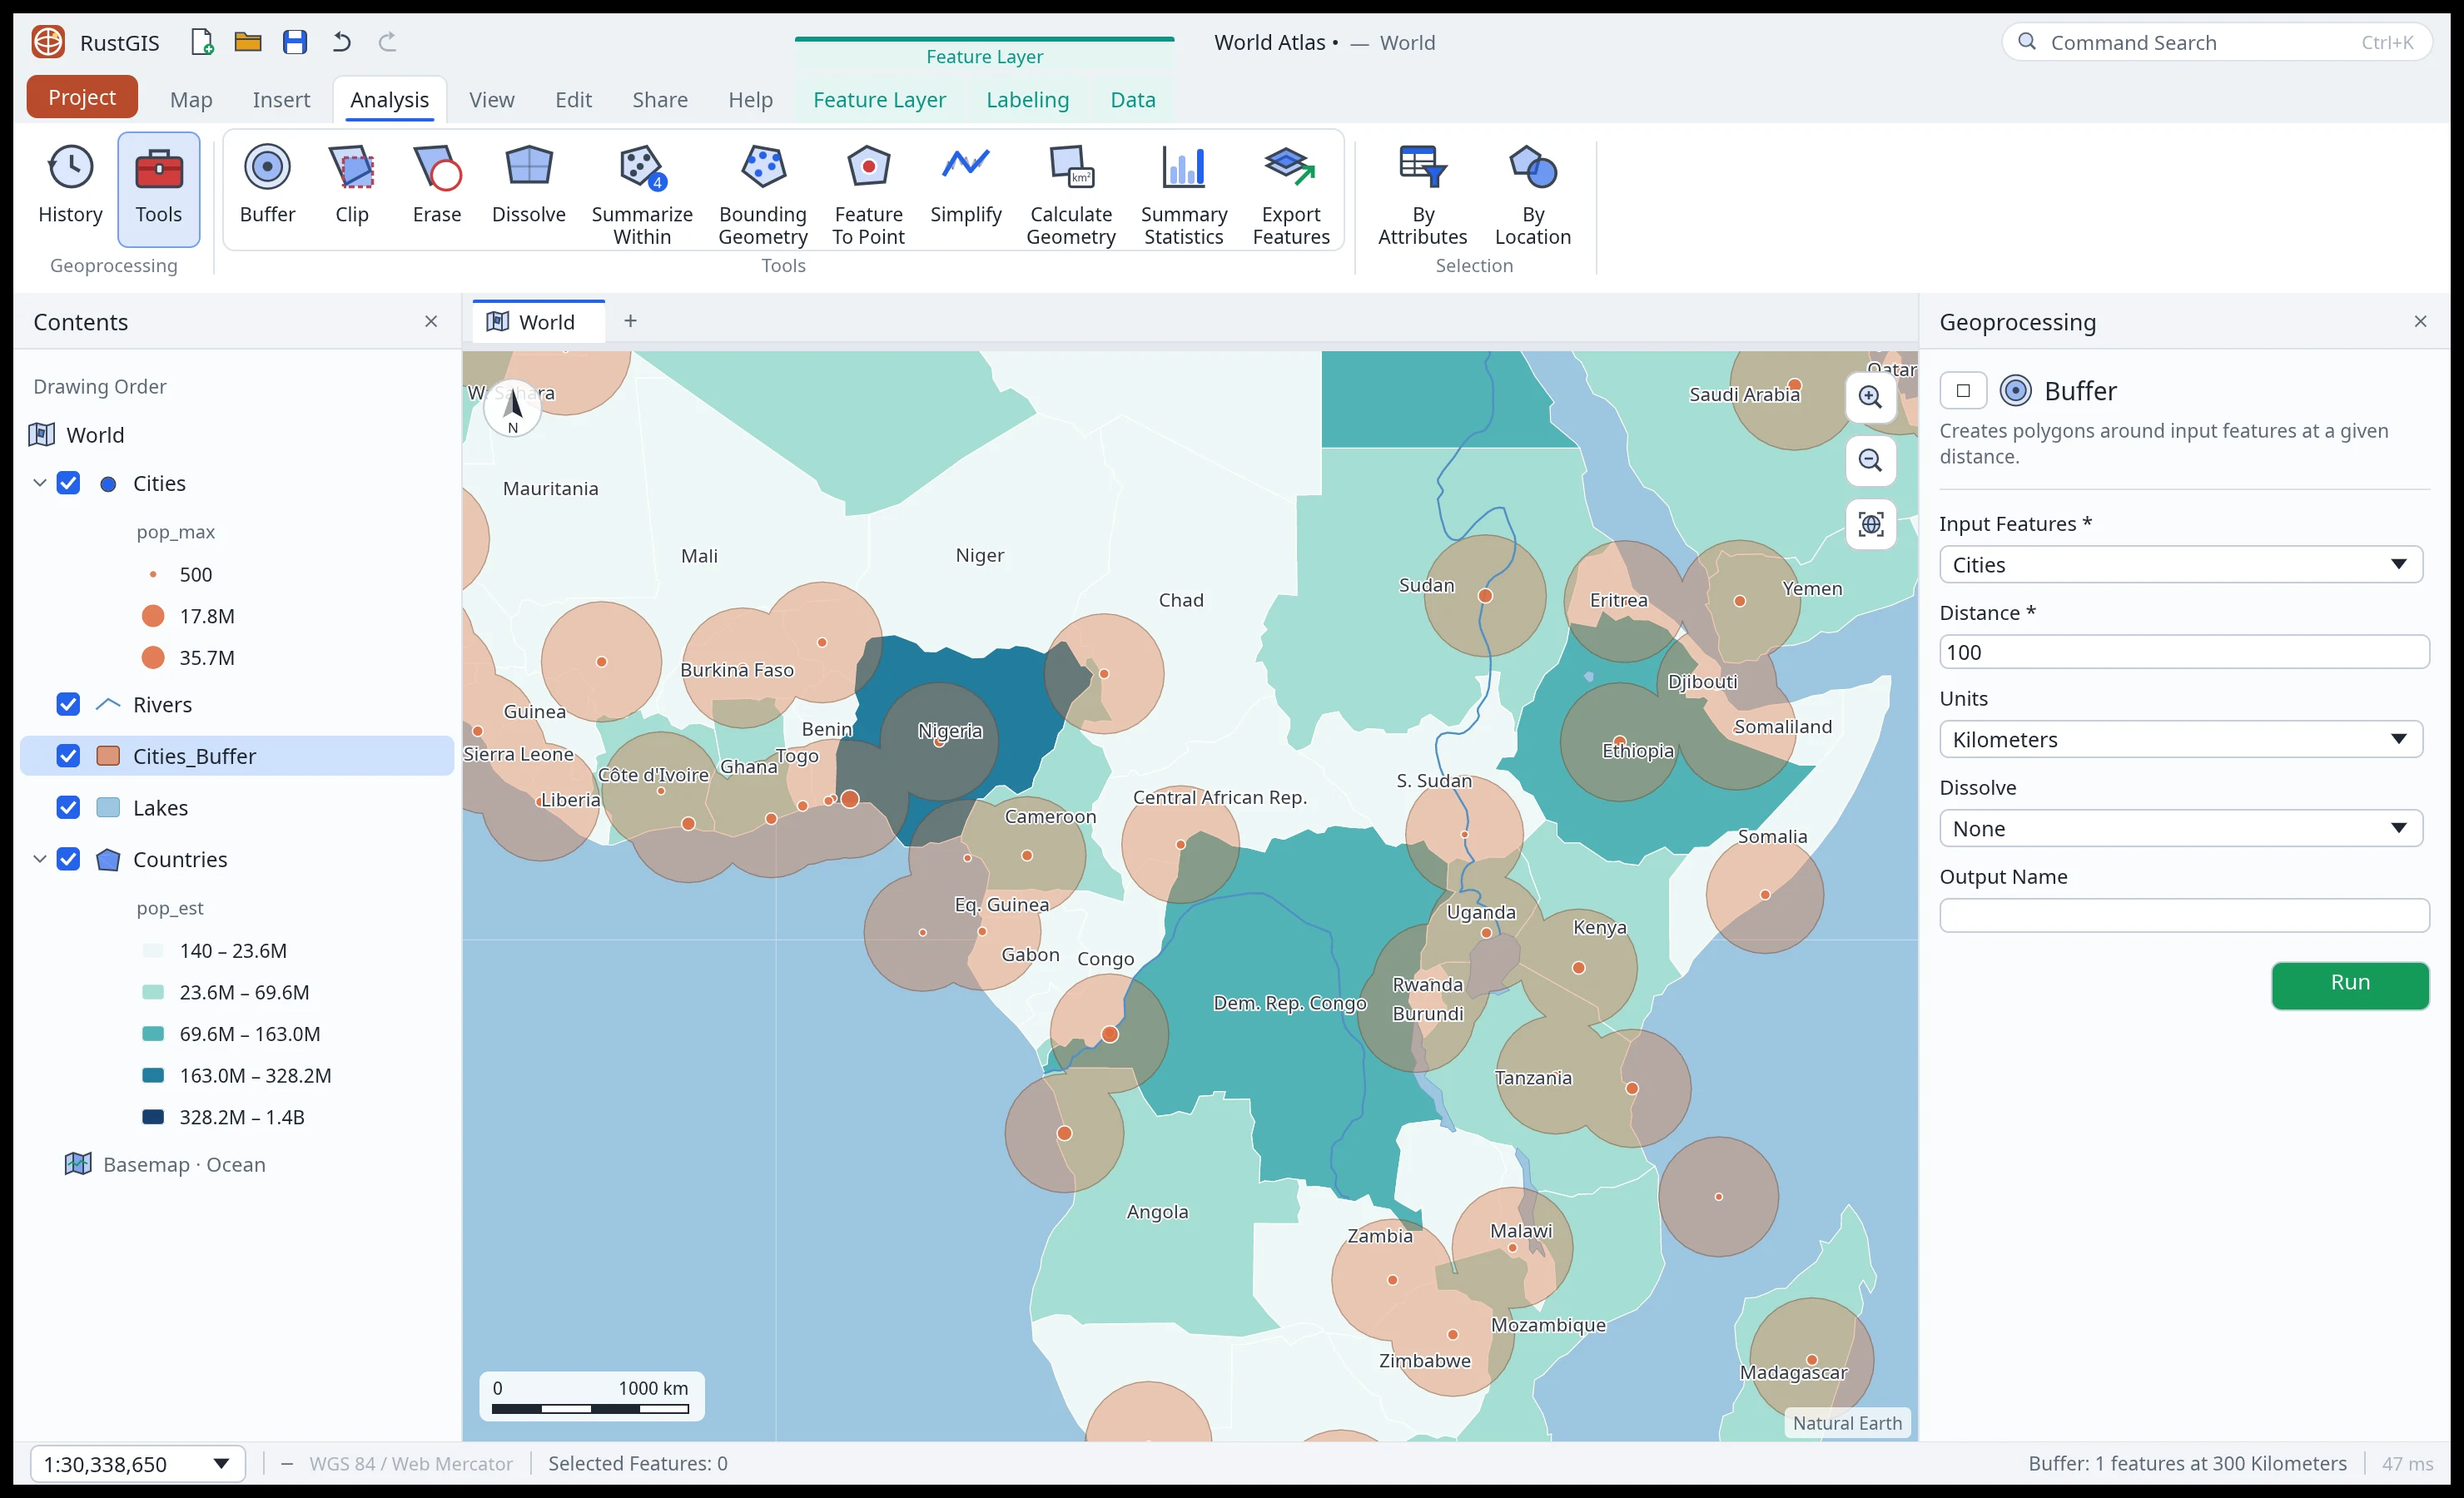 Analysis. A tool gallery, the Tools pane and 1,000+ GeoLibre tools. |
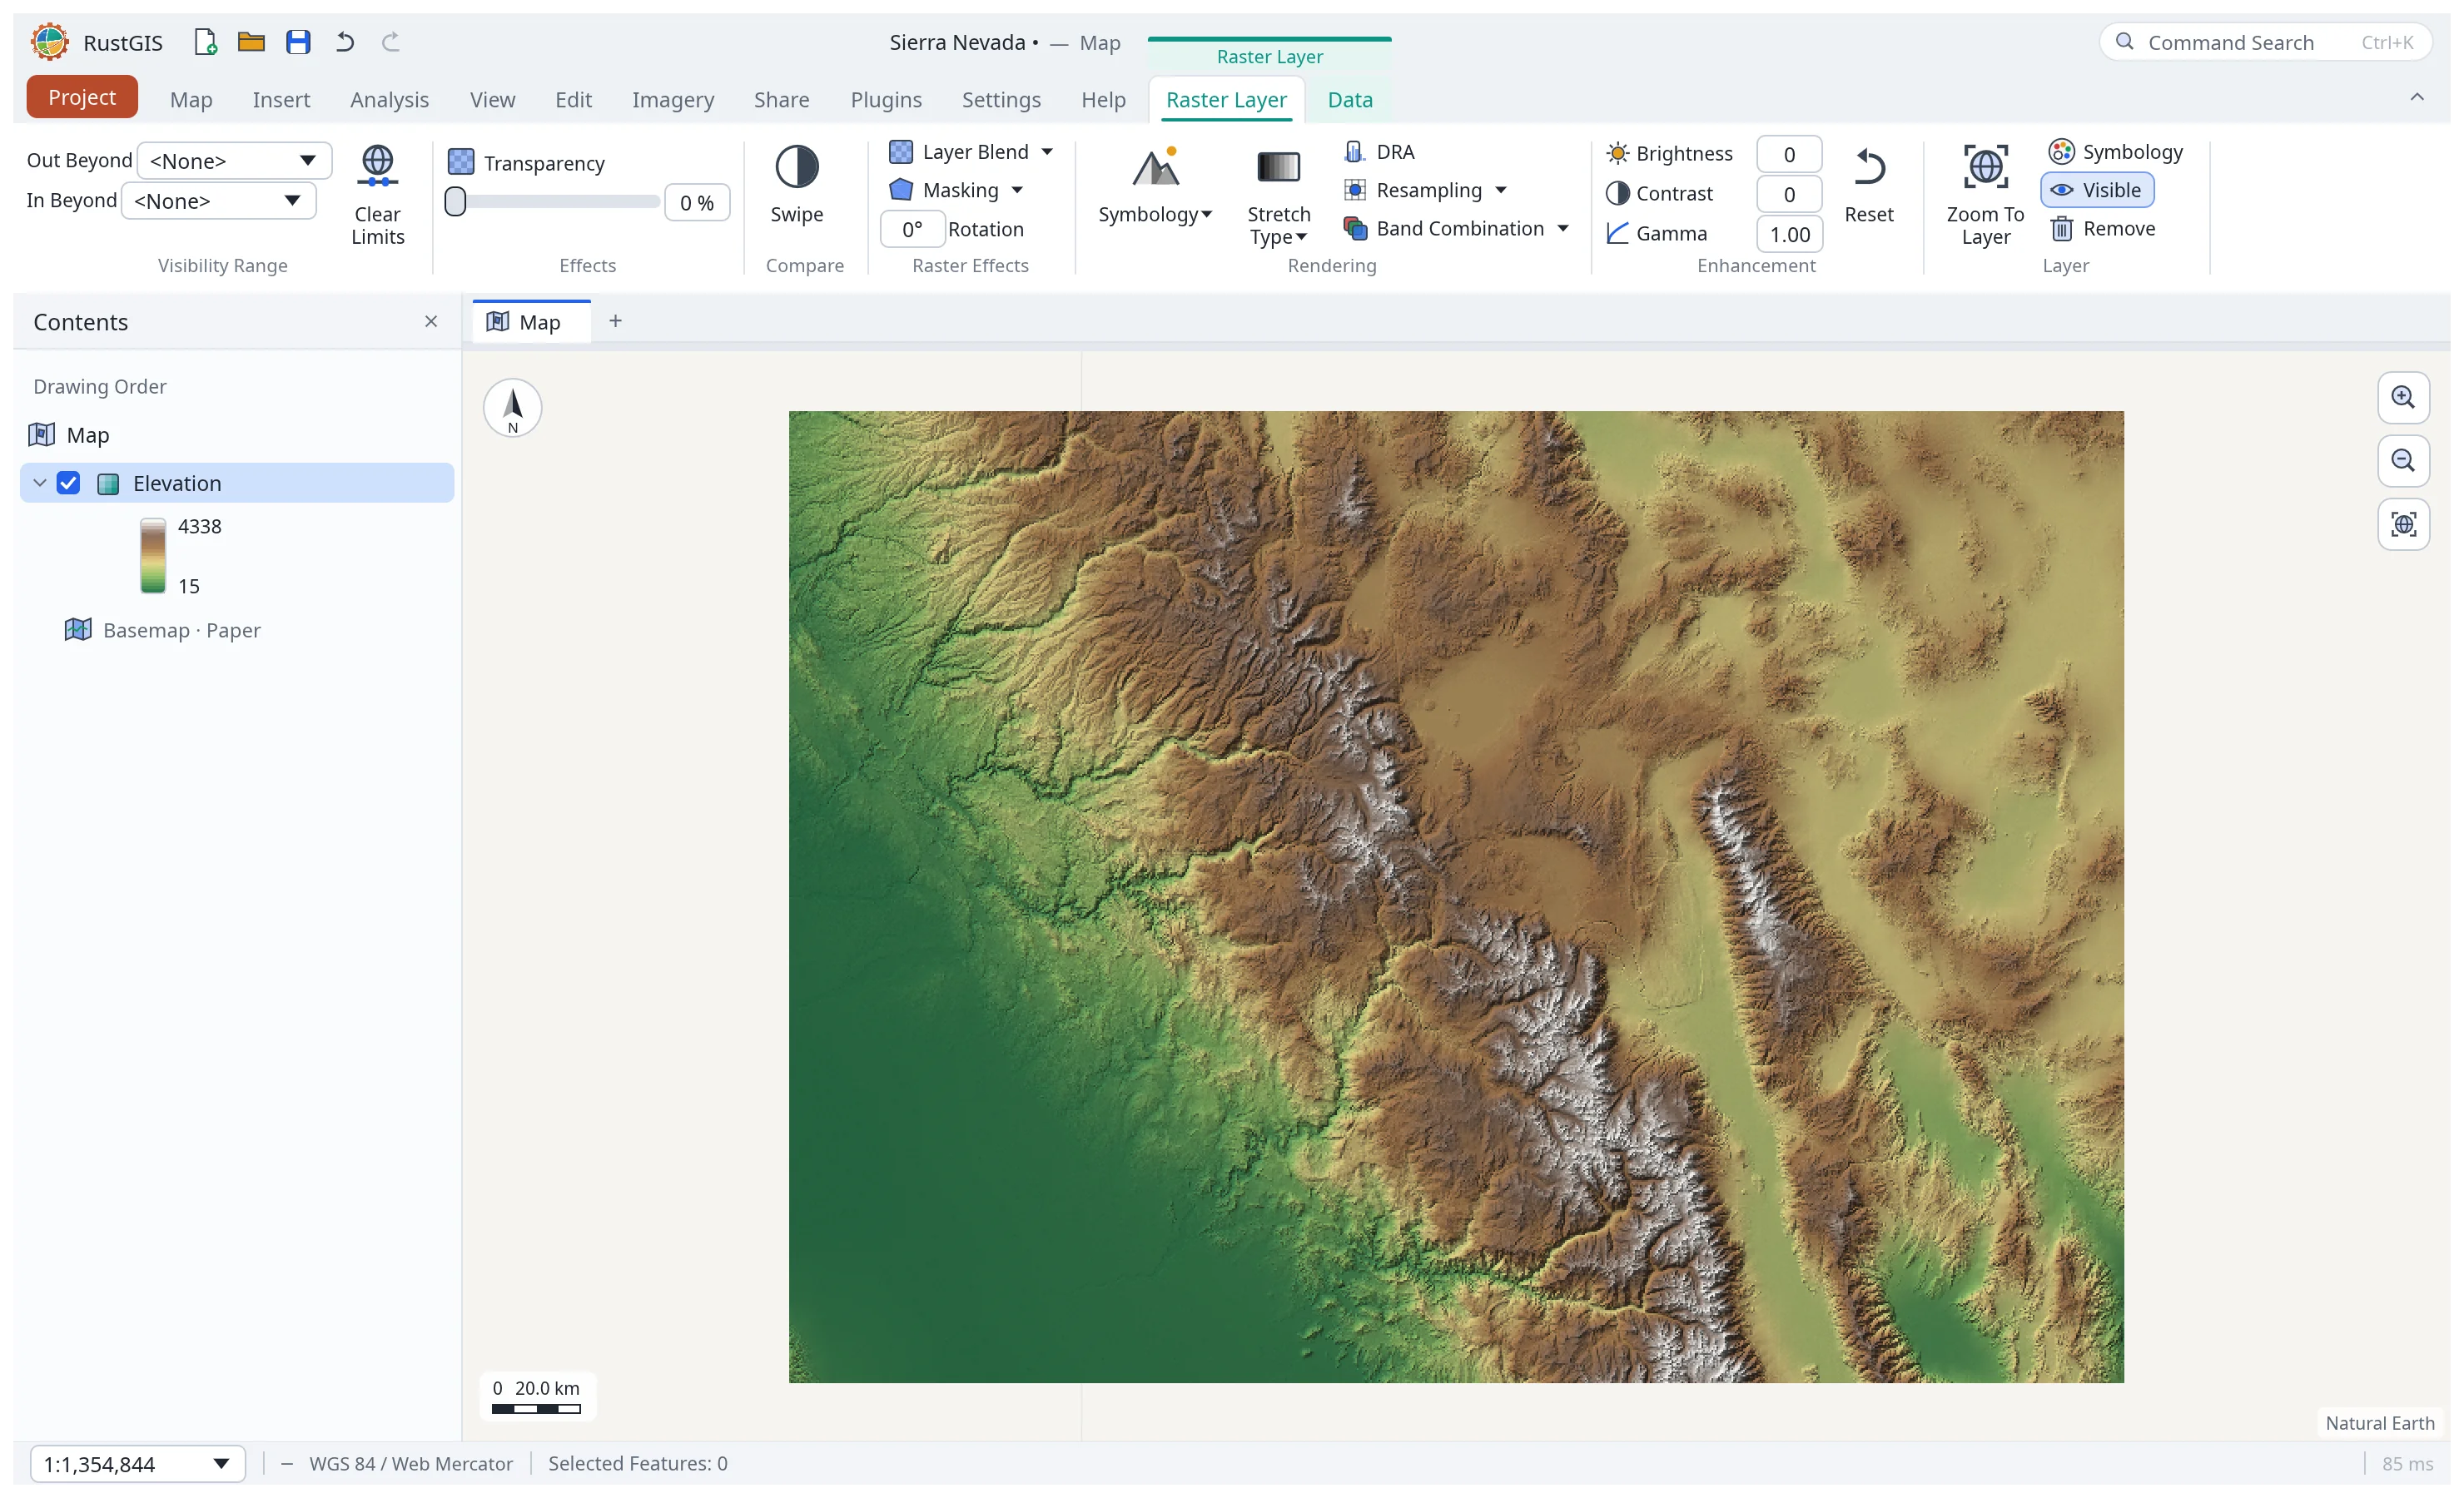 Rasters. GeoTIFF and COG, with stretch, RGB and shaded-relief styles. |
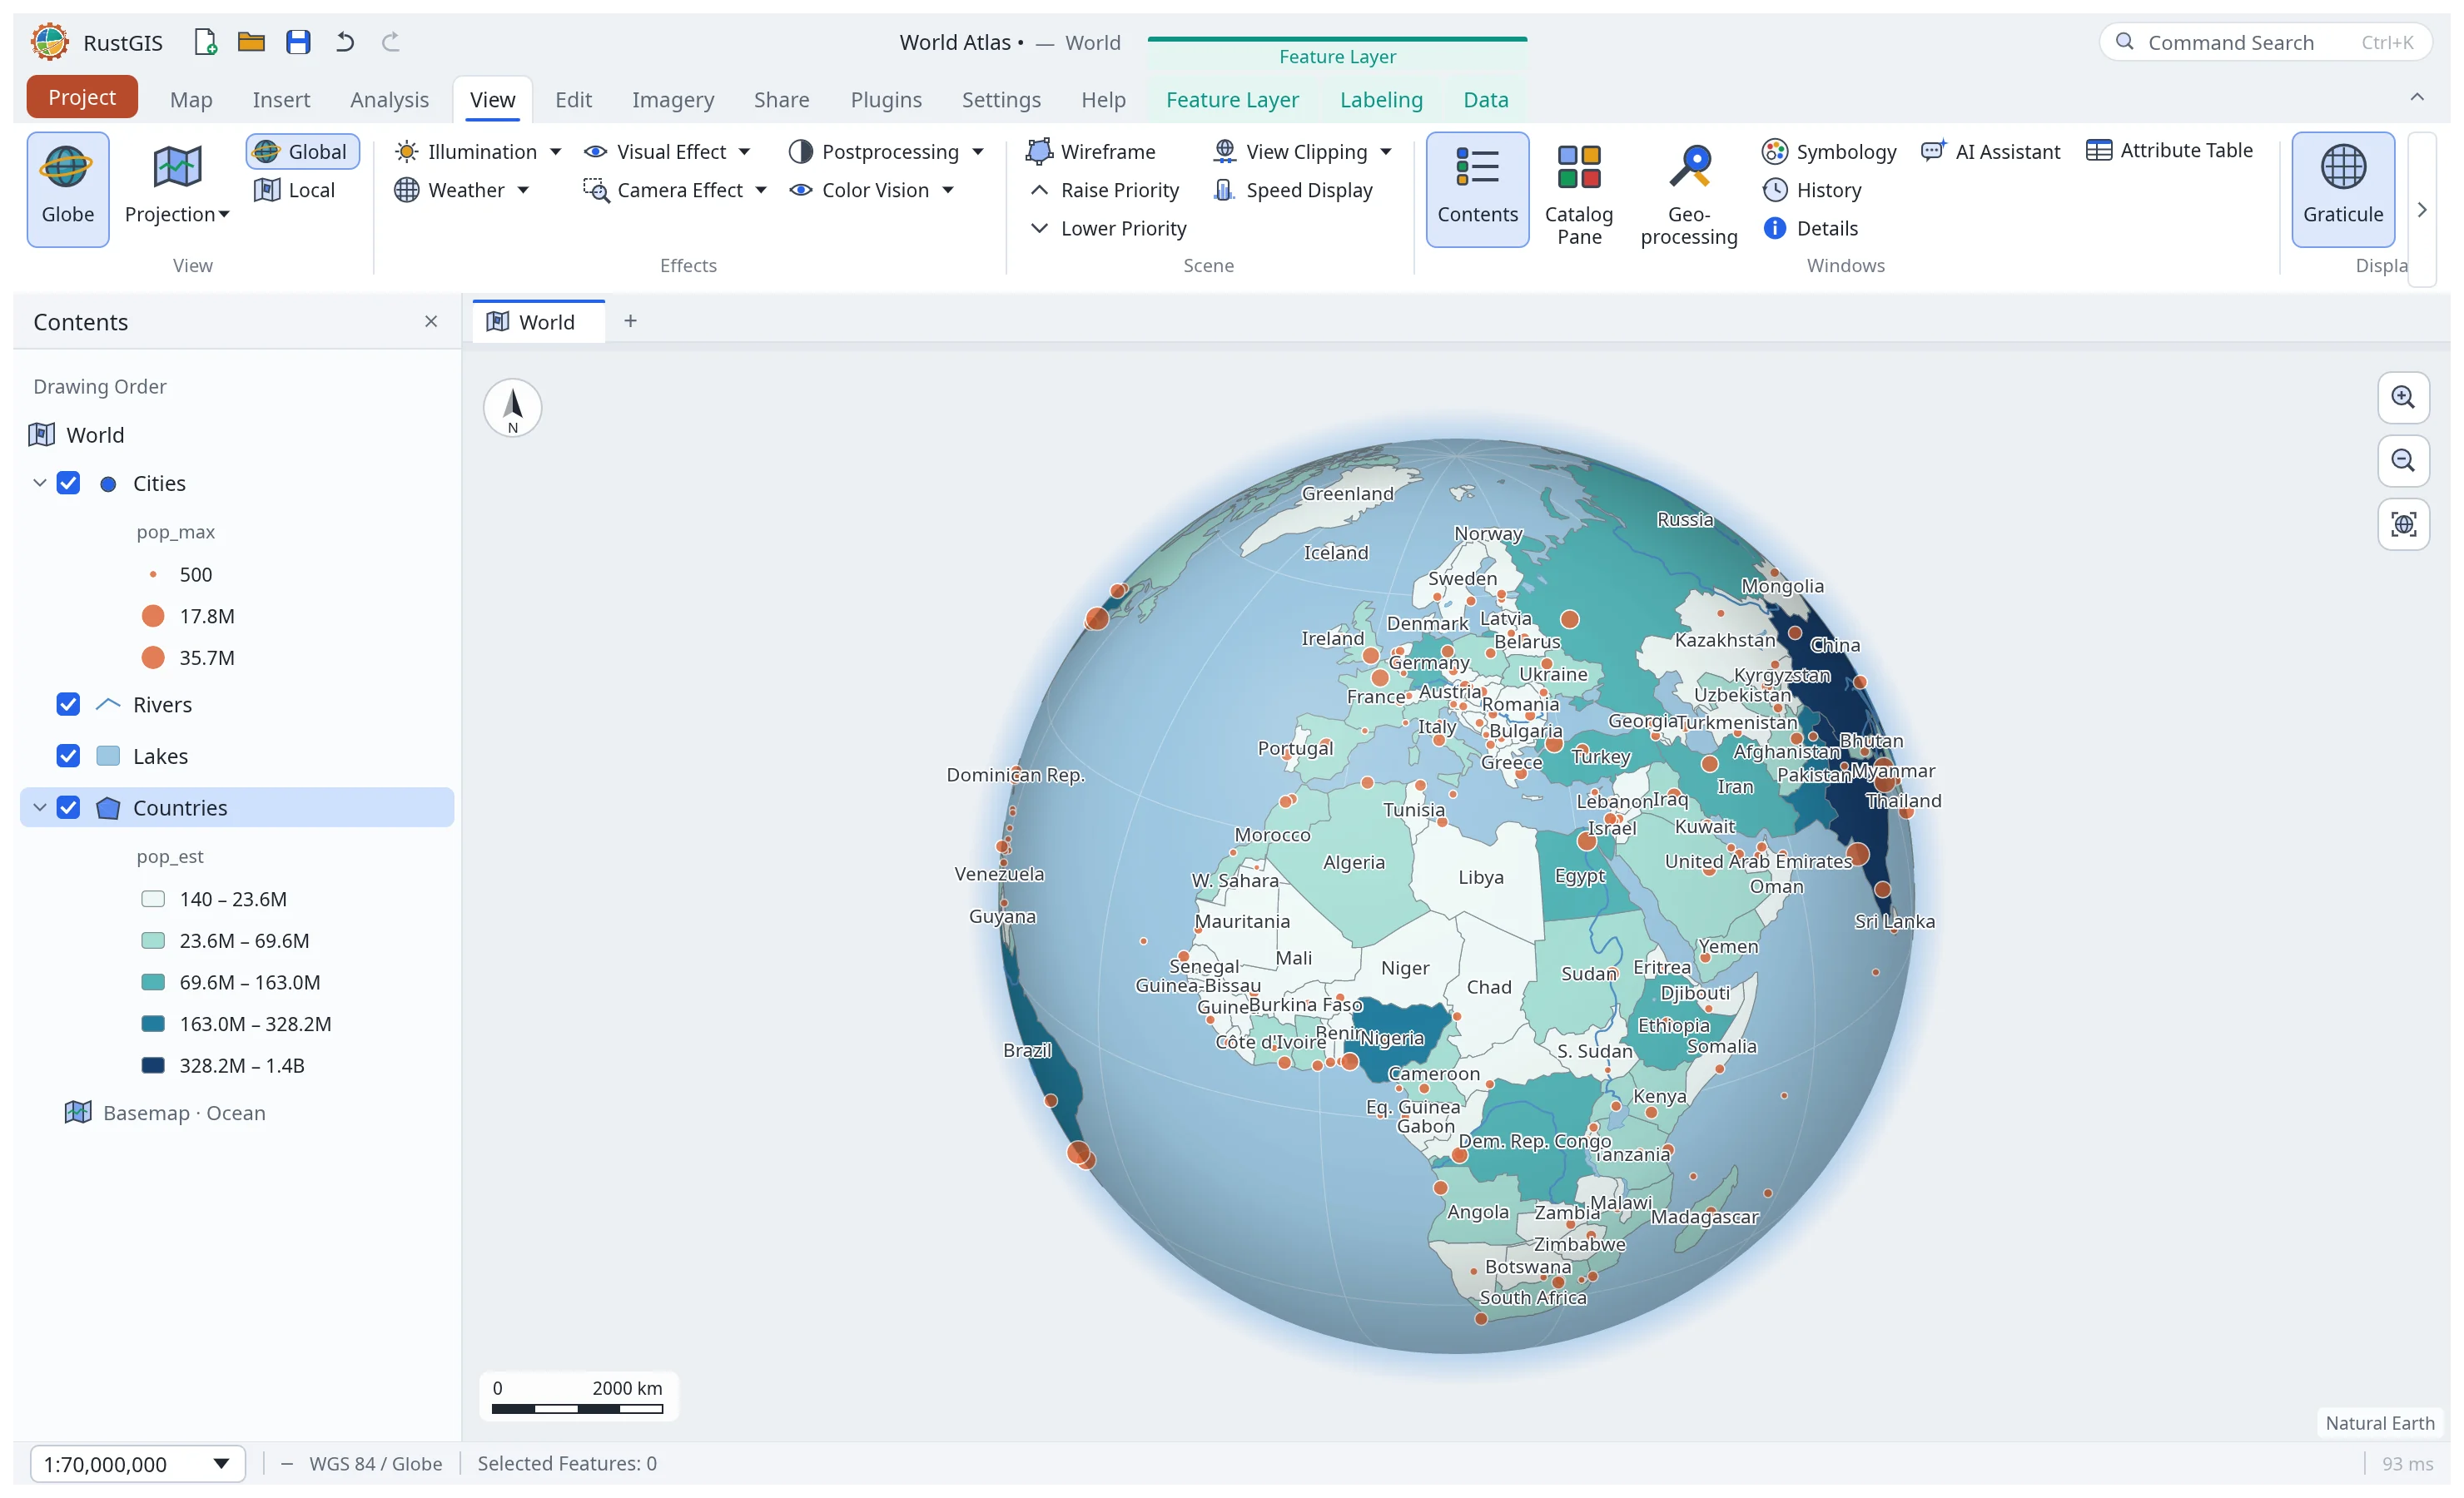 Globe and projections. A 3D globe, Equal Earth, Robinson or any EPSG code. |
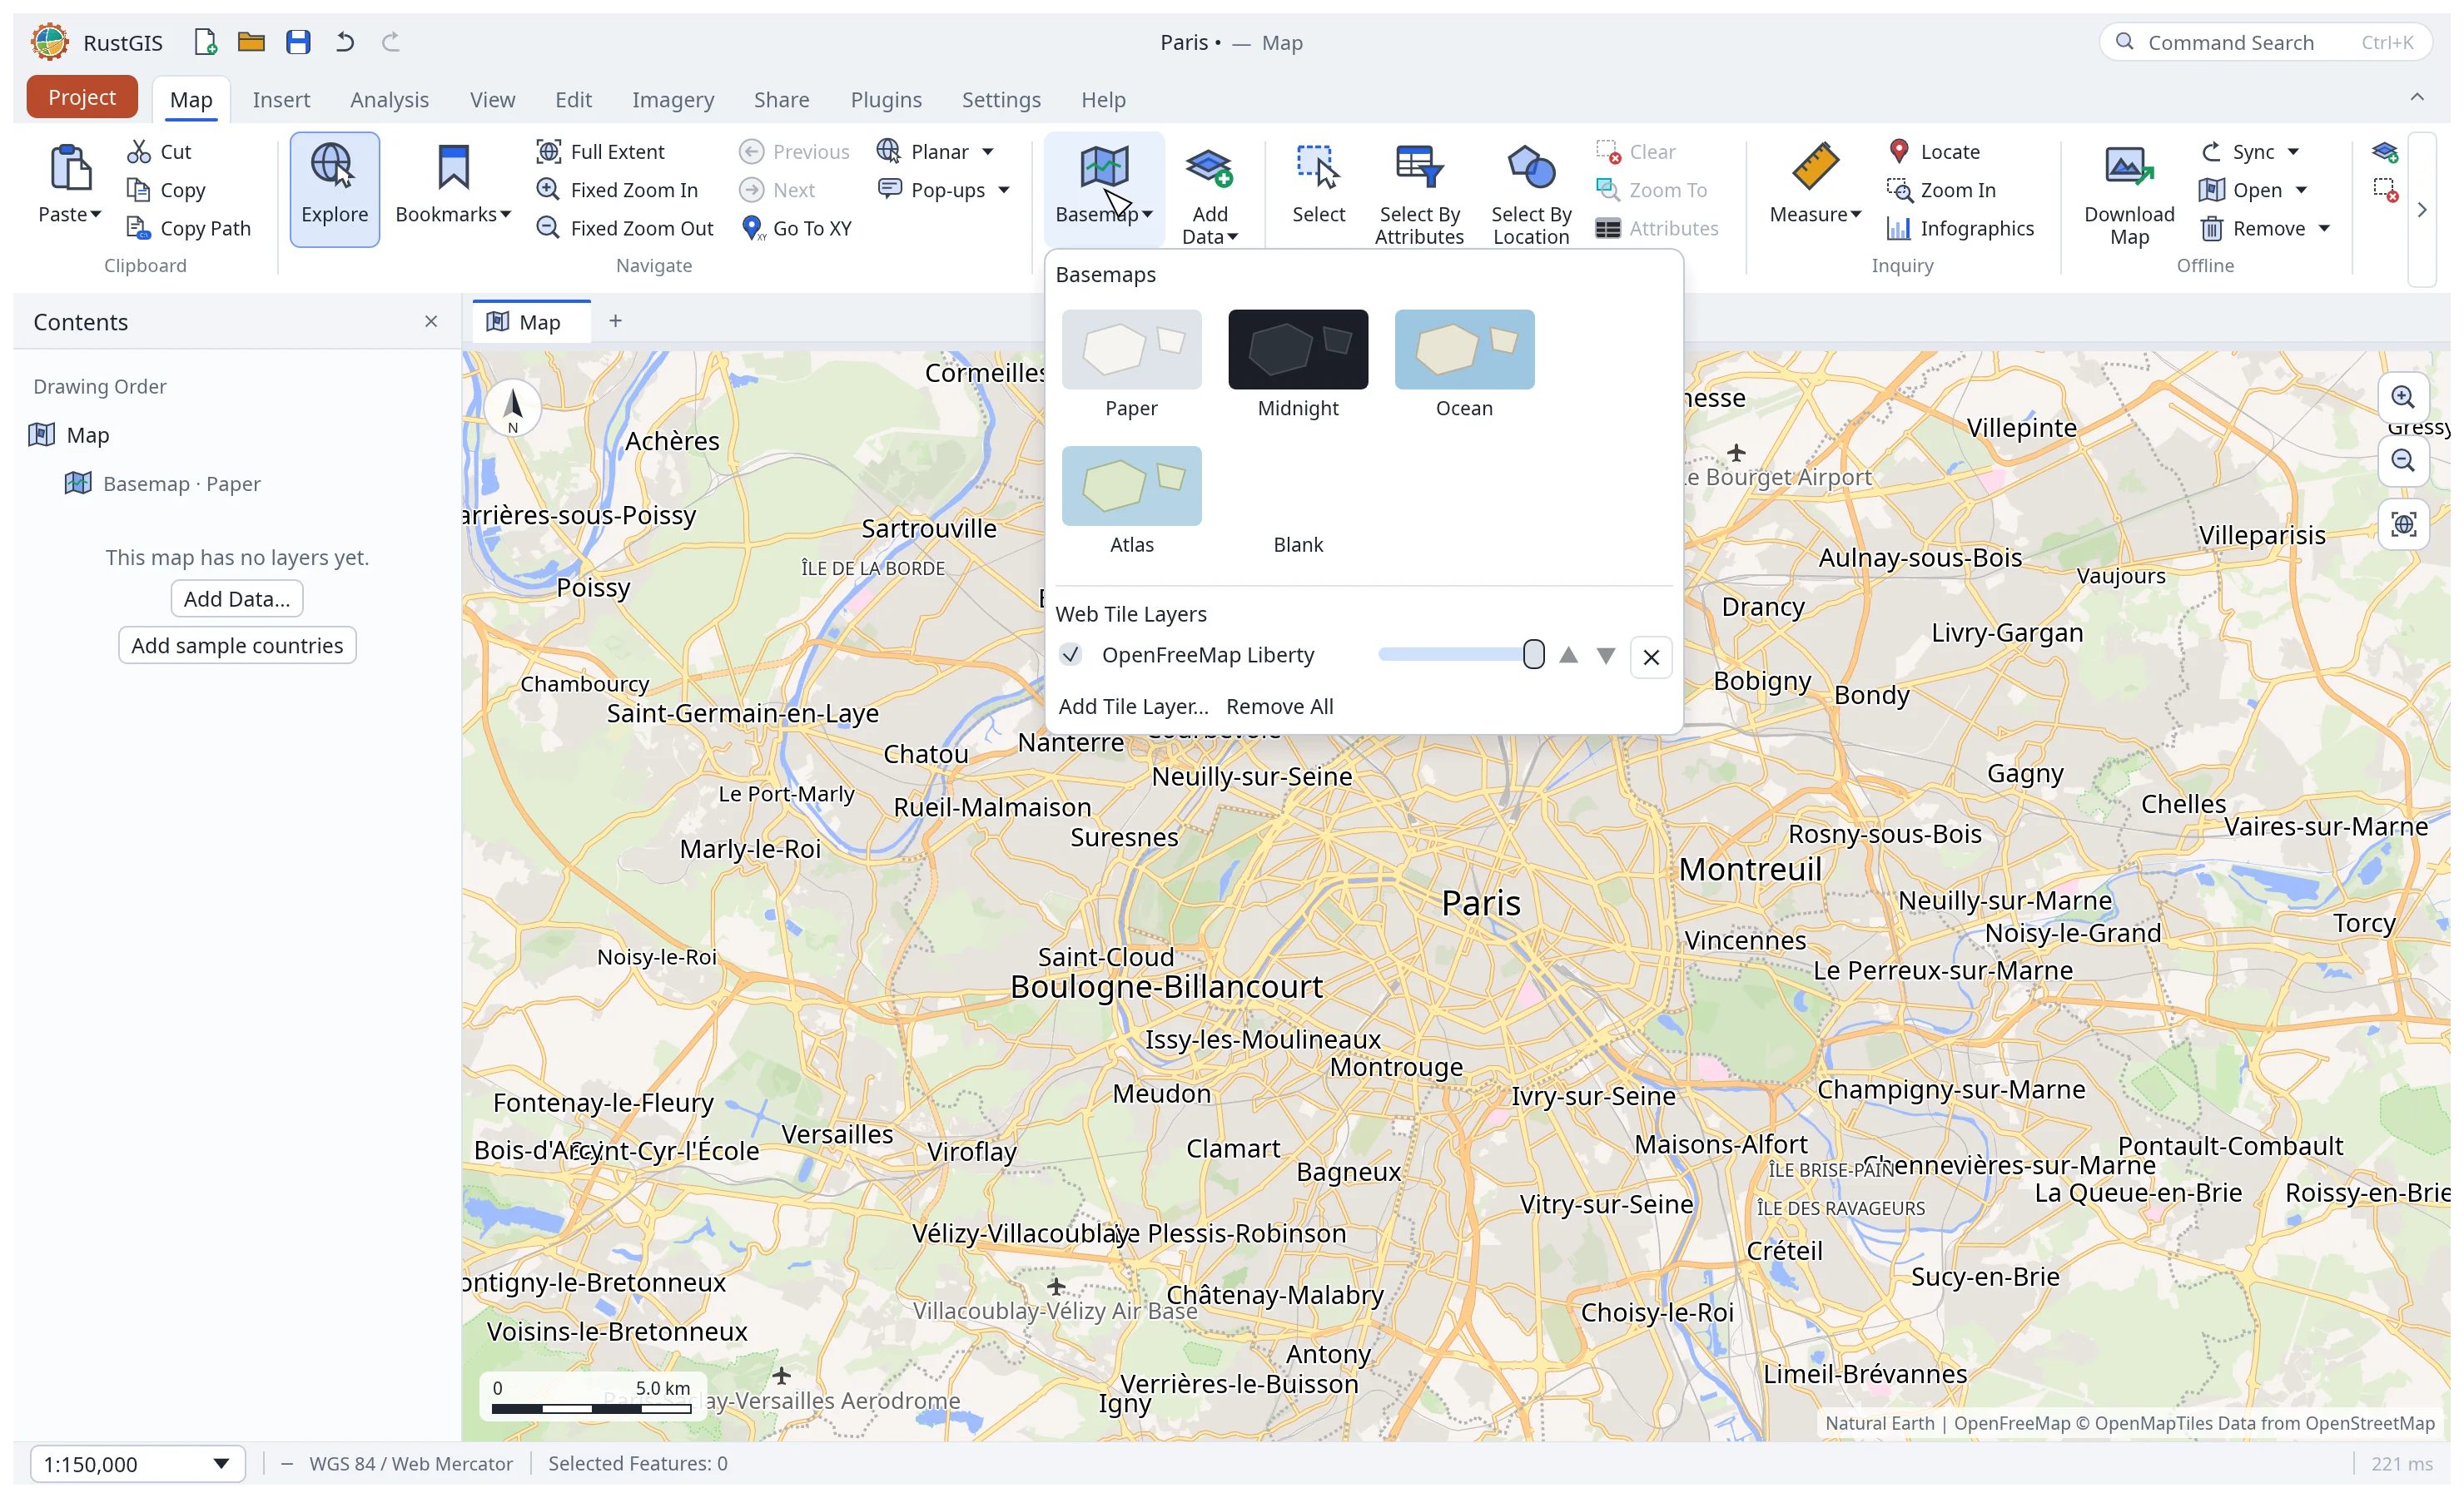 Web basemaps. XYZ, WMS and vector tiles, and MapLibre styles. |
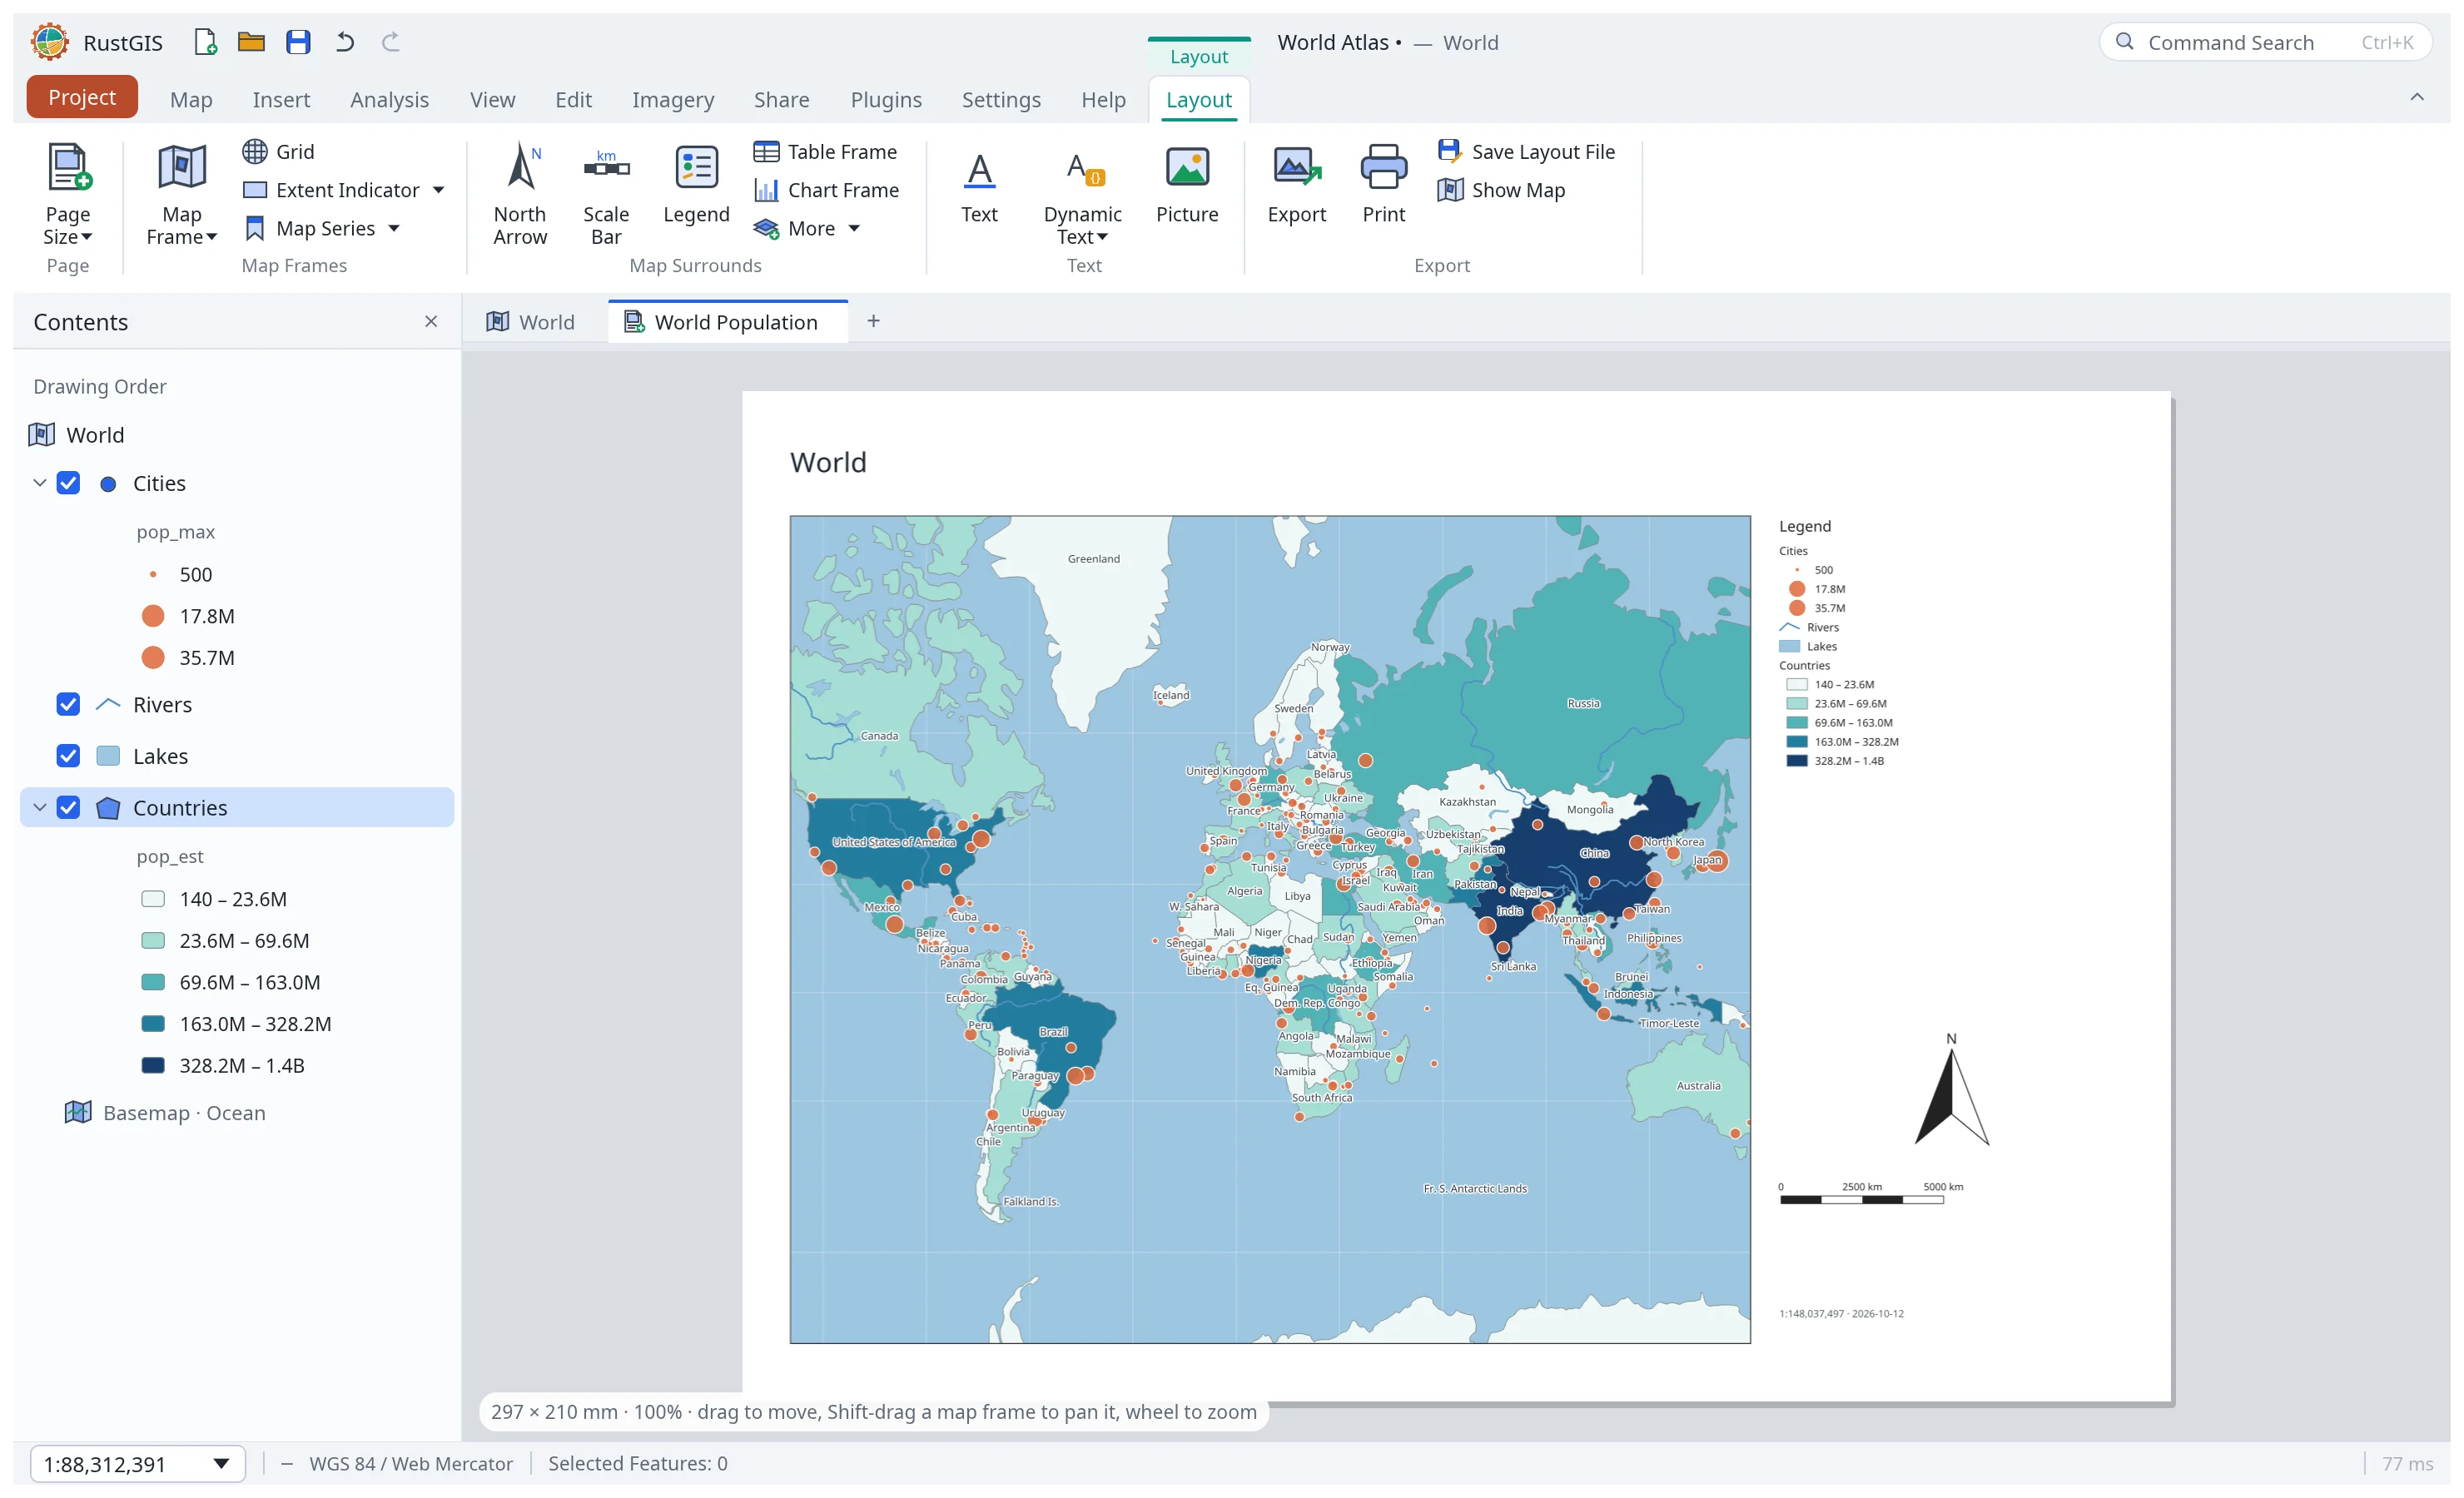 Layouts. Map frames, legends, scale bars, map series and PDF export. |
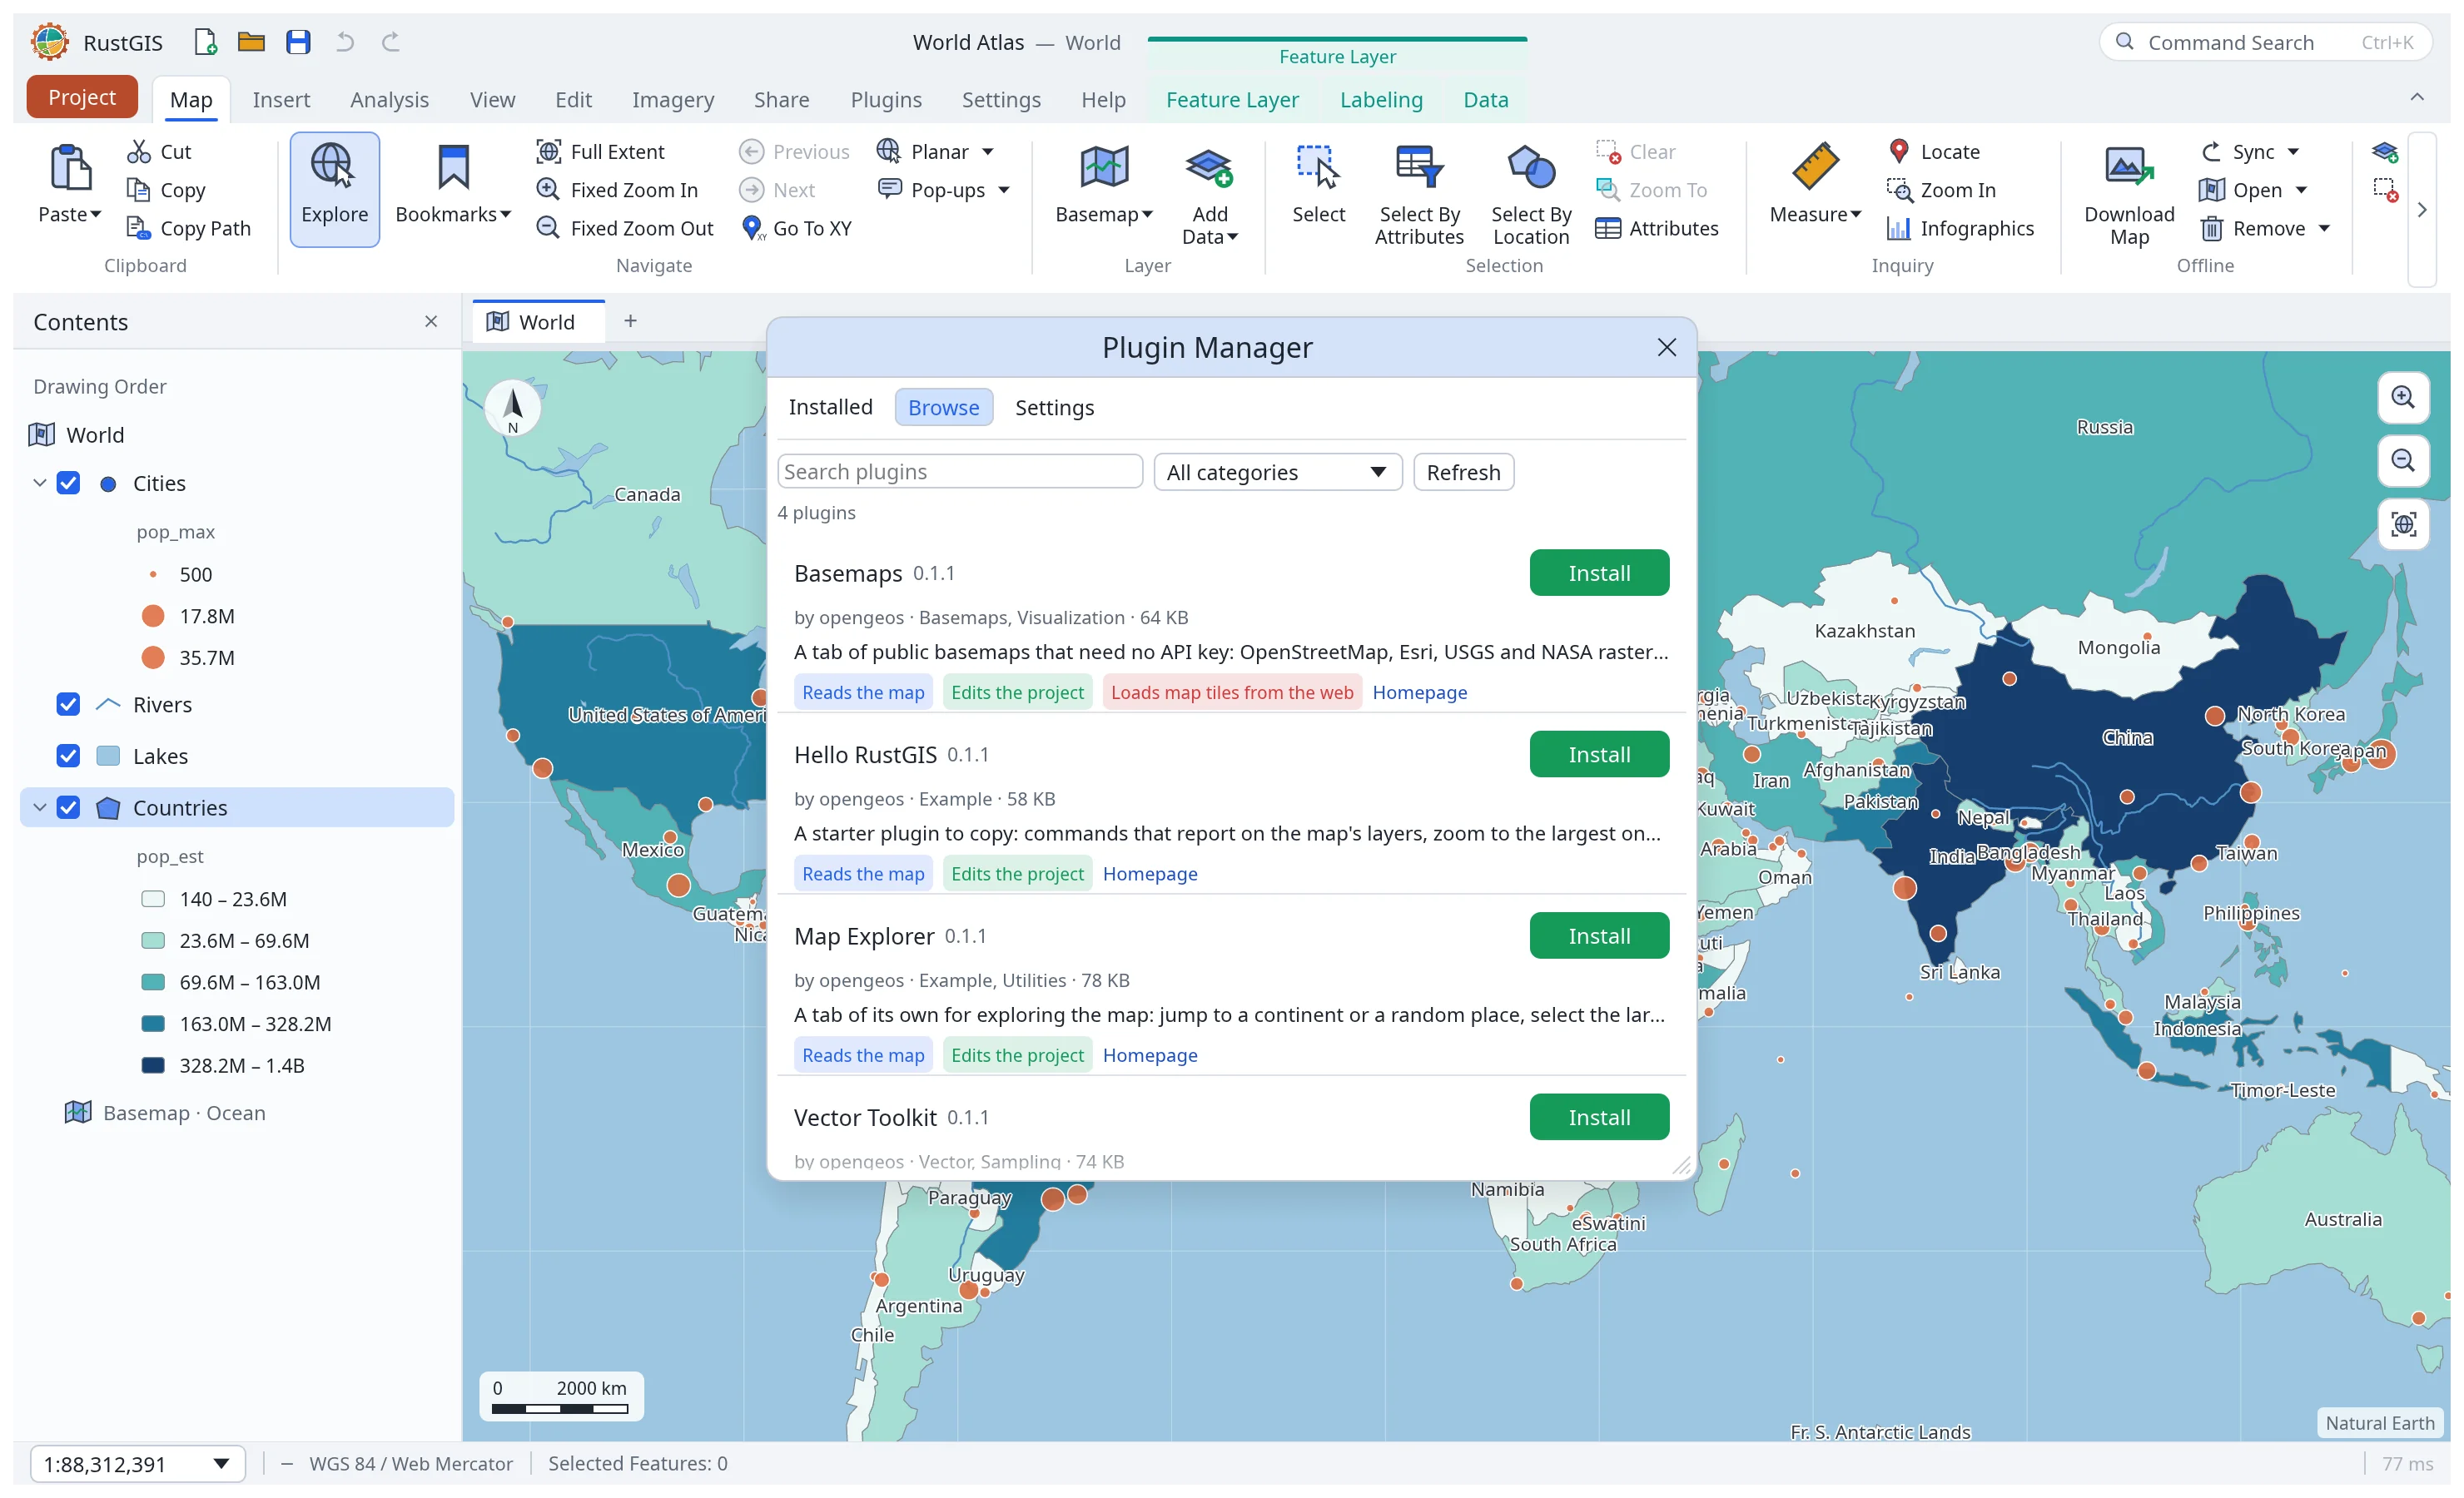 Plugins. Install sandboxed plugins from plugins.rustgis.app. |
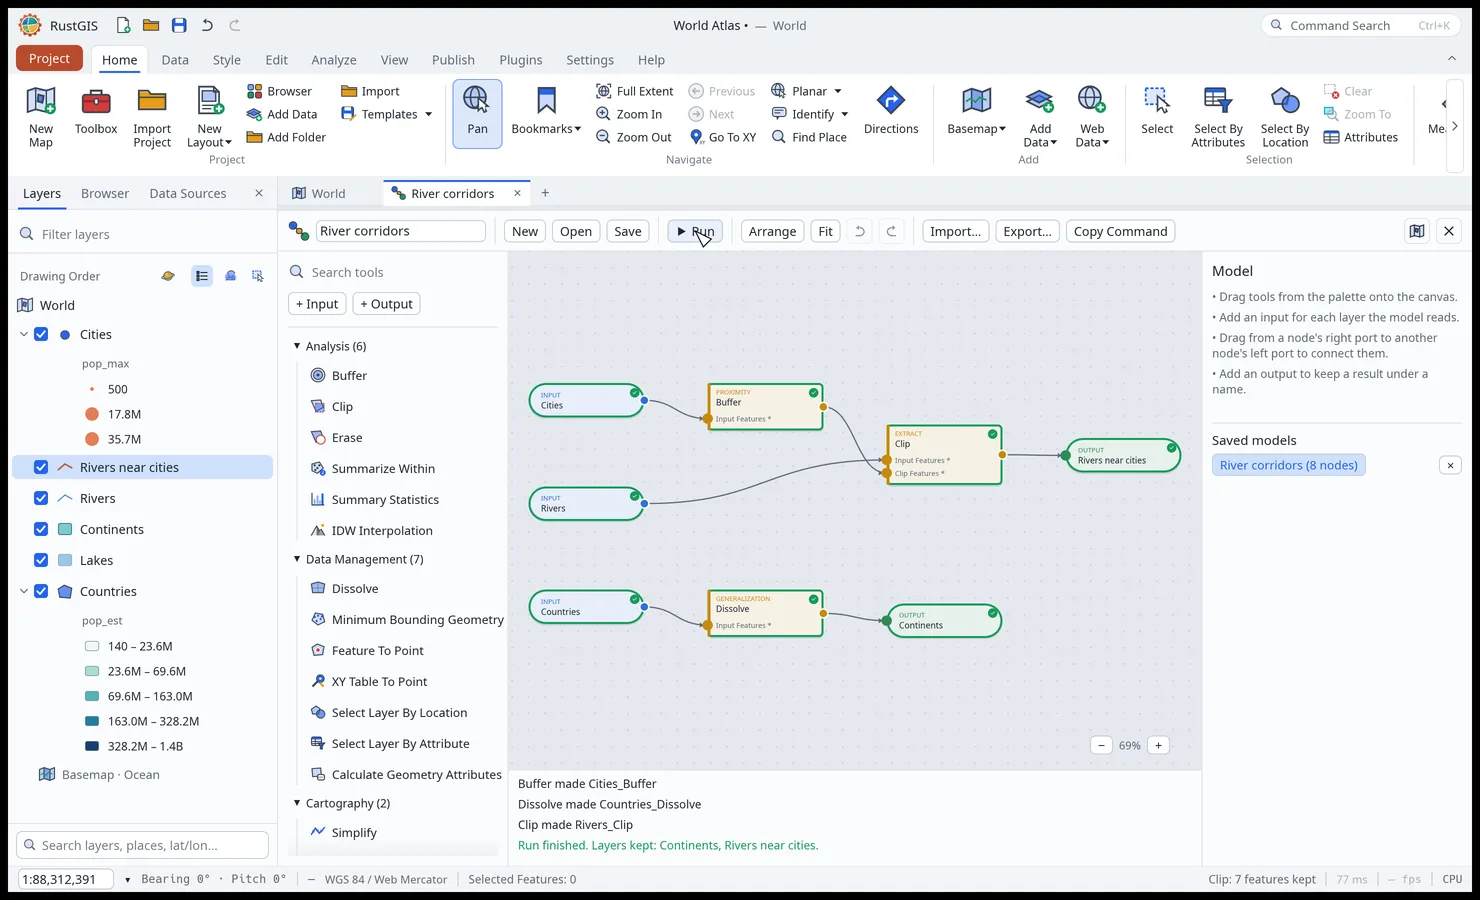 ModelBuilder. Chain tools on a node canvas and run them in one go. |
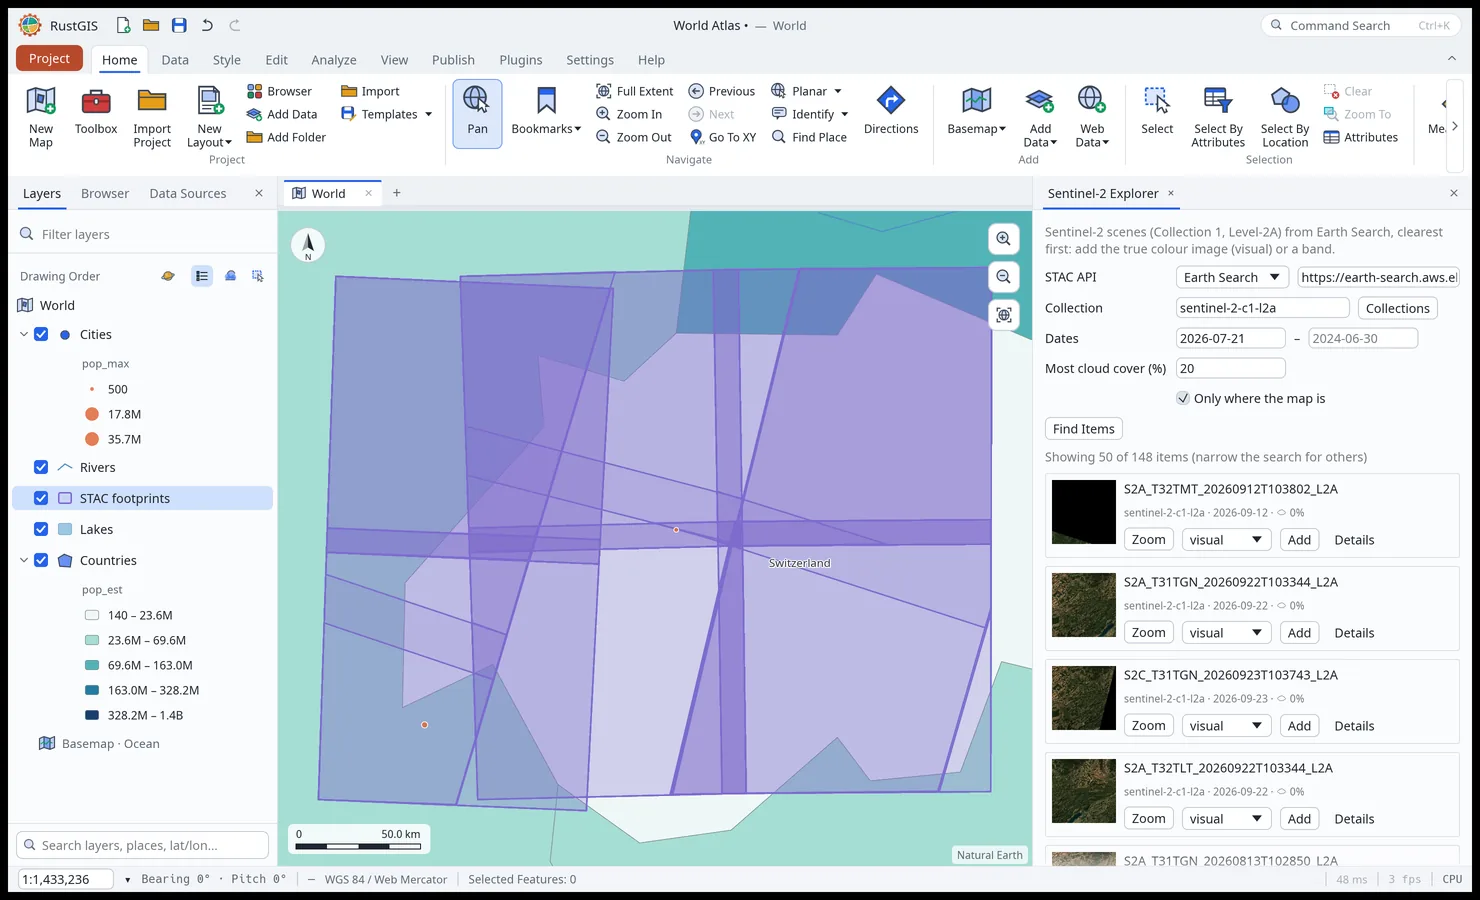 Web Data. STAC, Overture Maps, NASA and open-data portals, where the map is. |
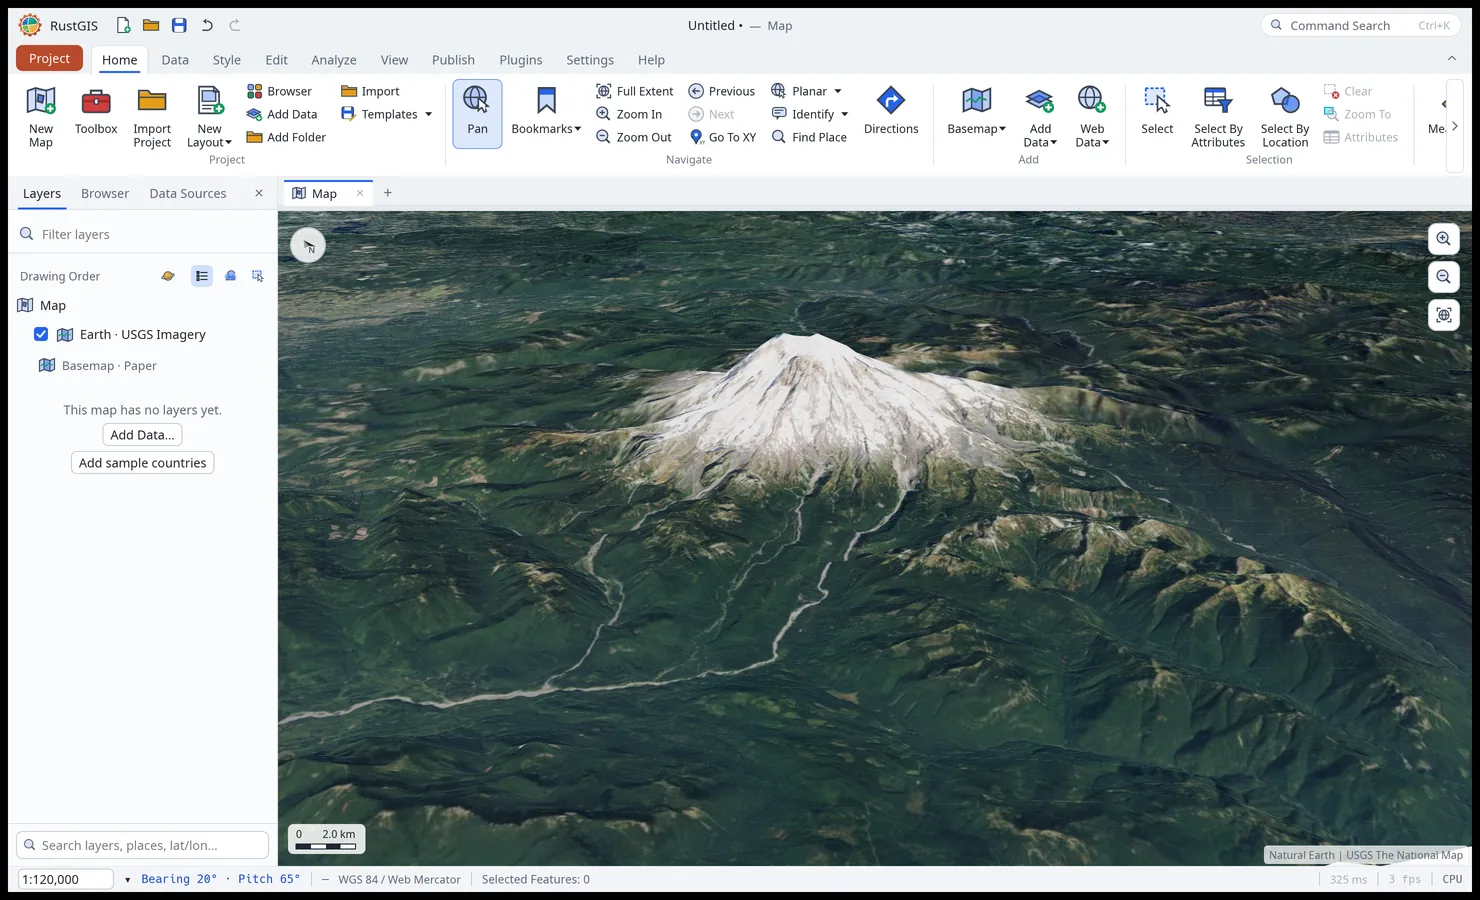 Terrain. Tilt the map and drape it over elevation. |
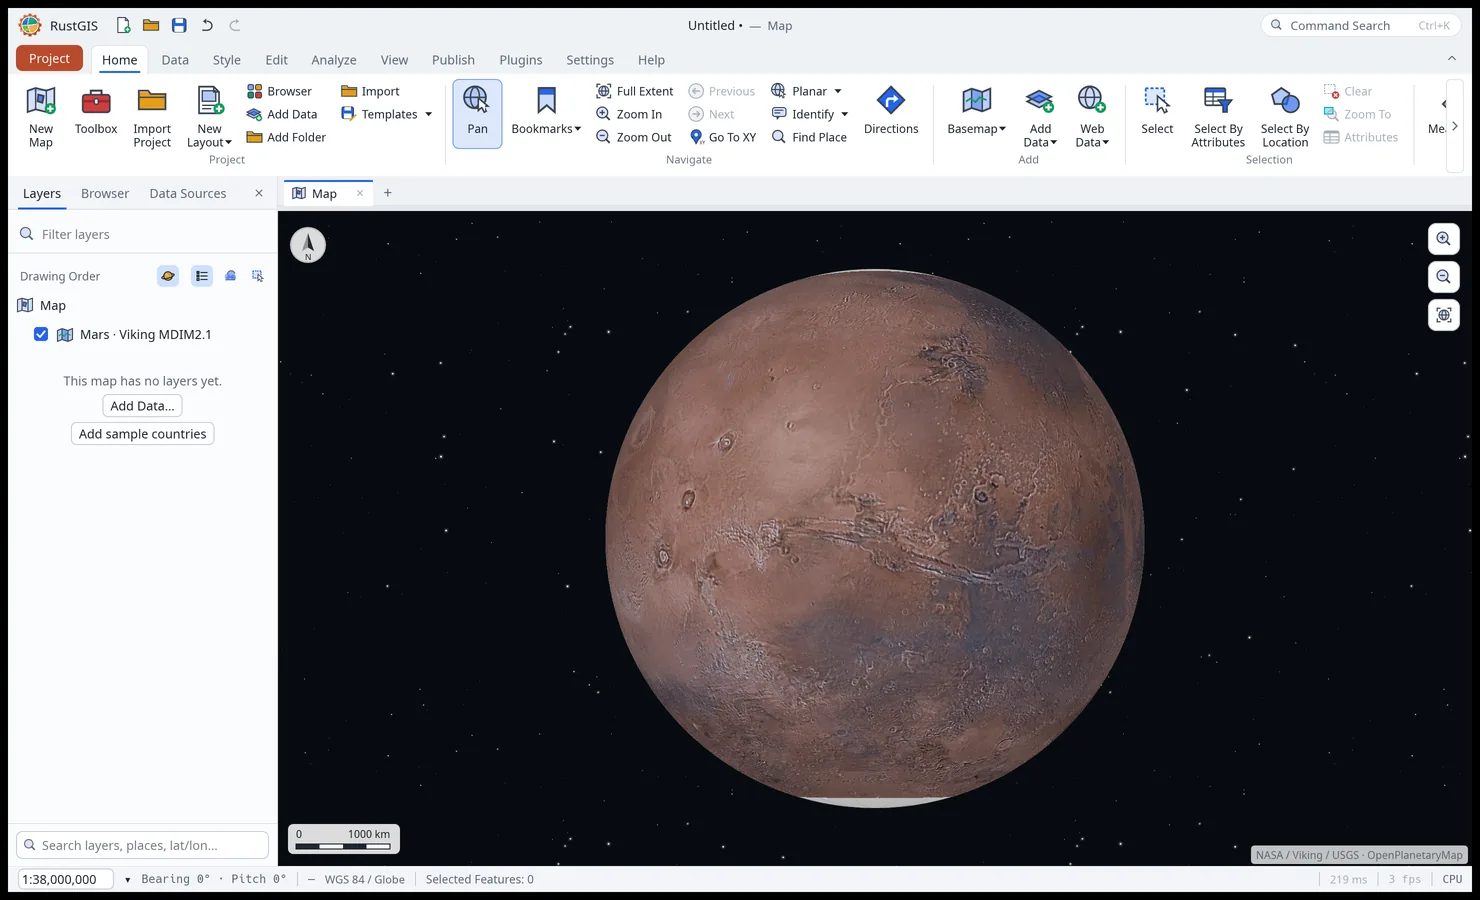 Other worlds. The Moon, Mars and nine more bodies, on their own basemaps. |
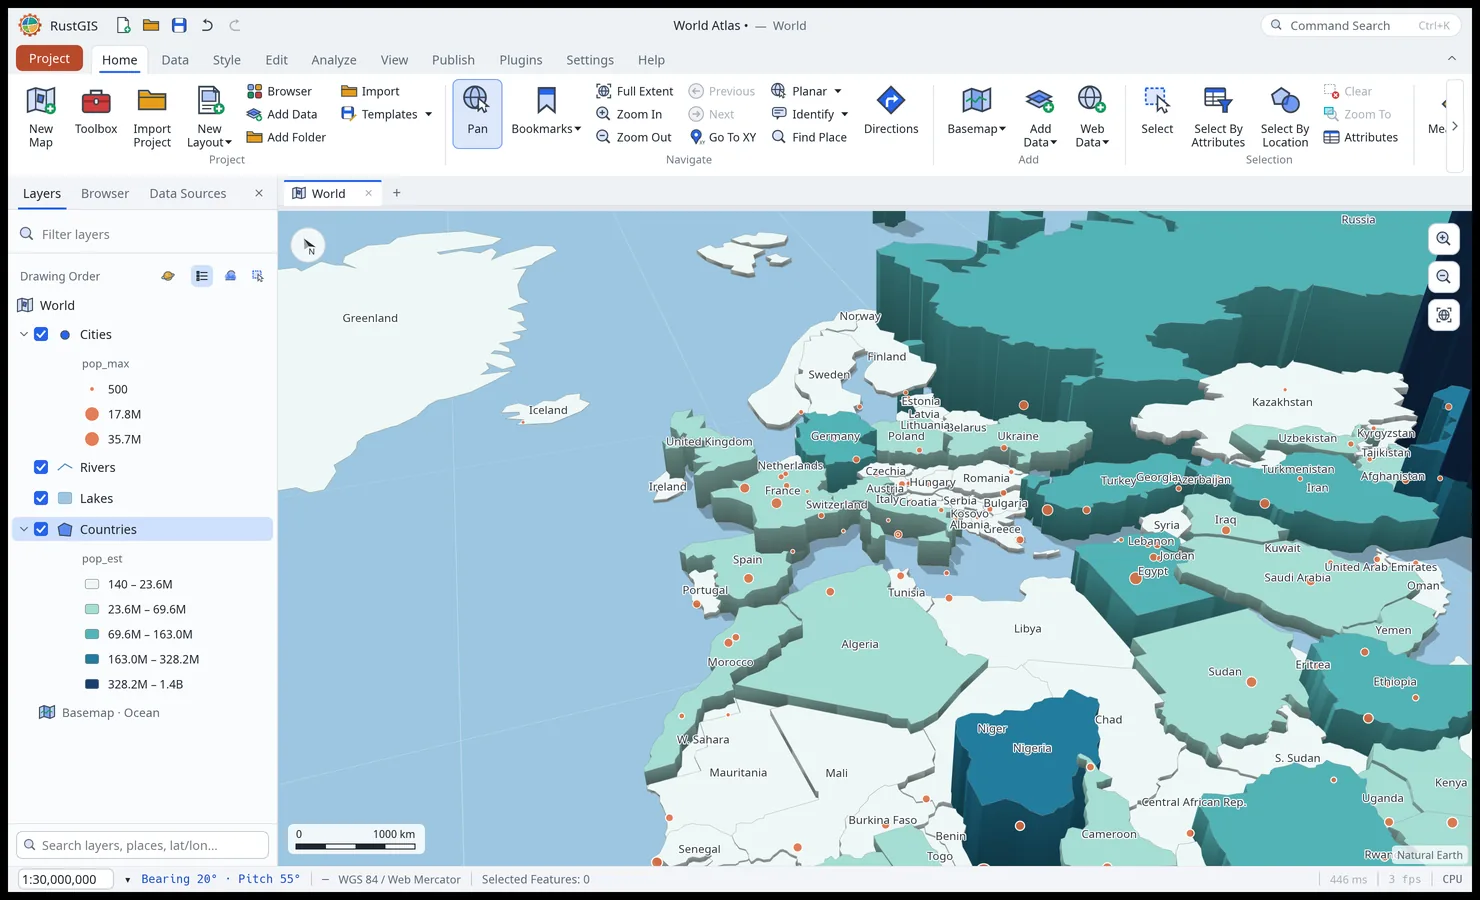 Extrusion. Stand features up by a field, lit and shaded. |
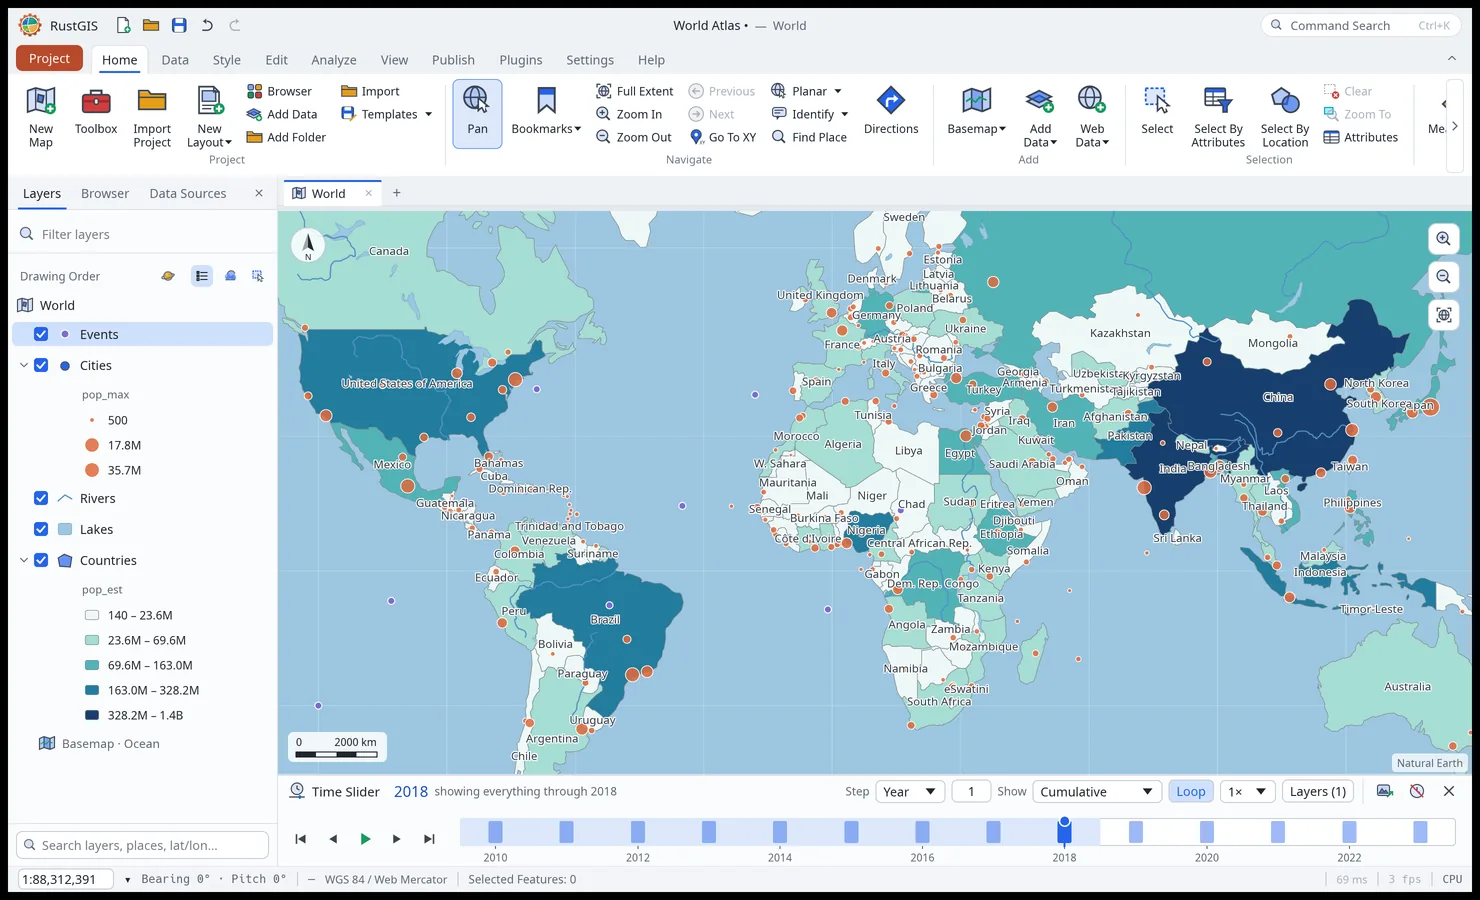 Time Slider. Step dated features and imagery through time. |
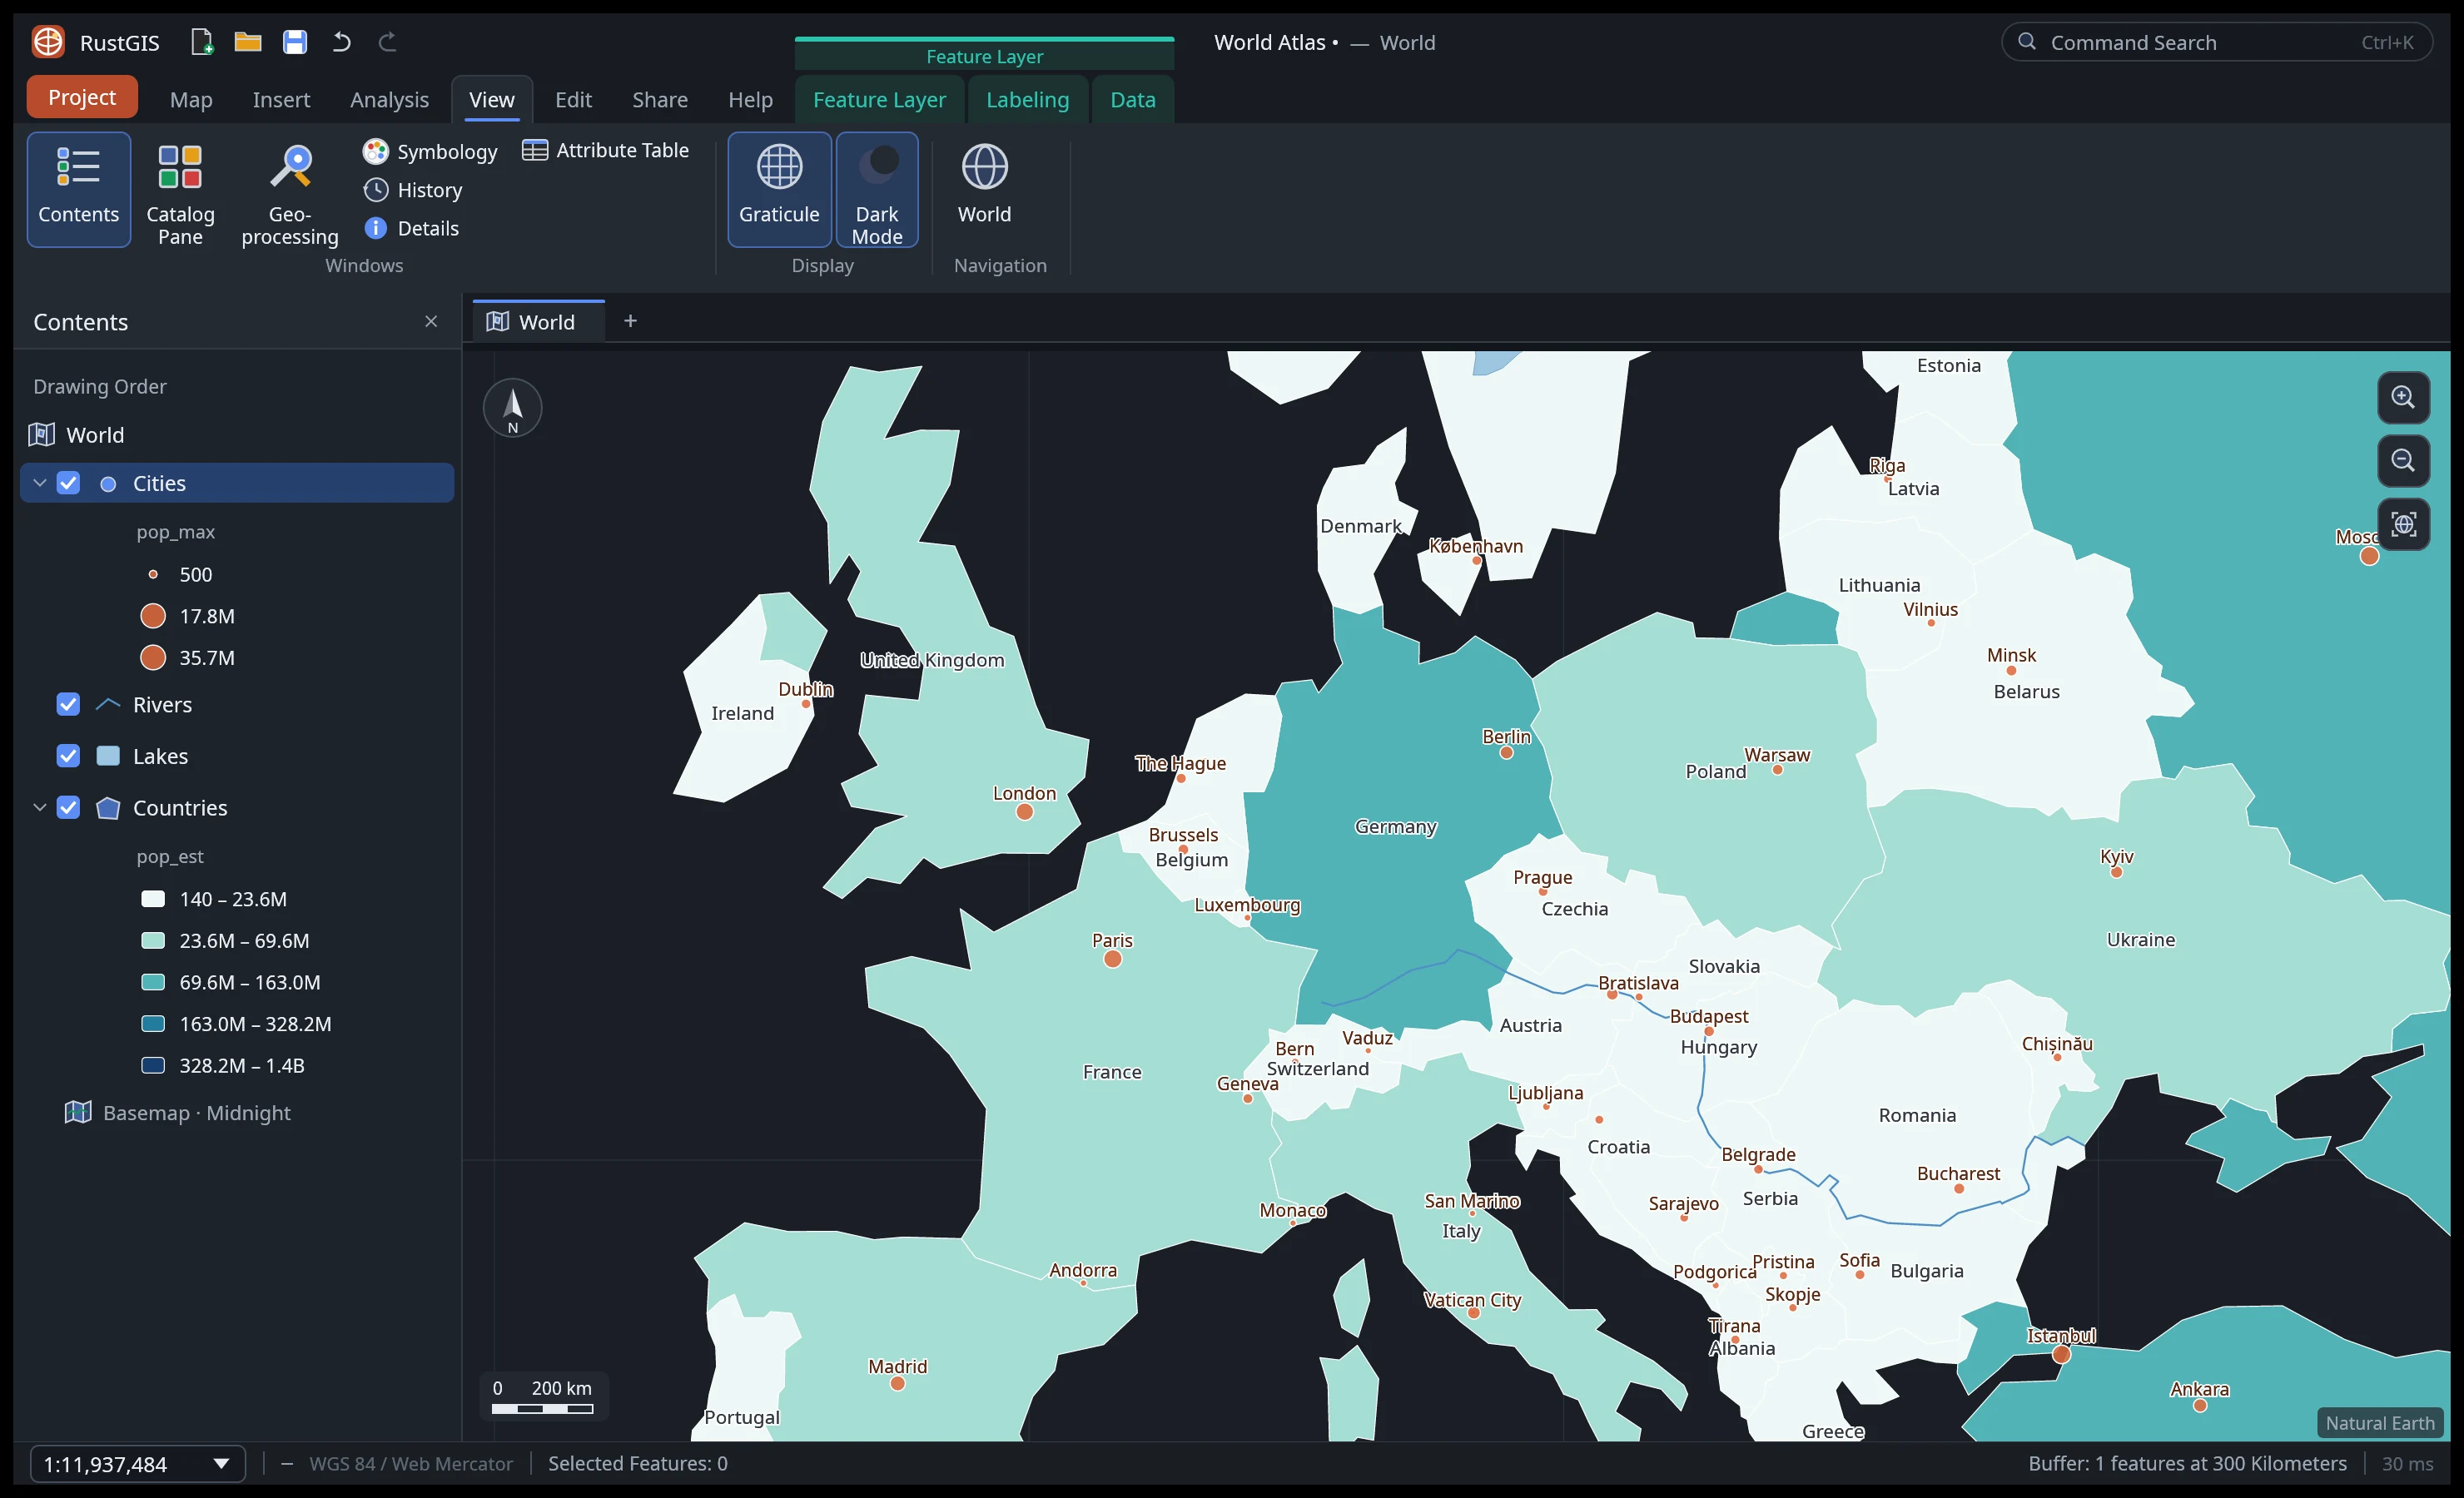 Dark mode and the View tab's effects, panes and linked views. |
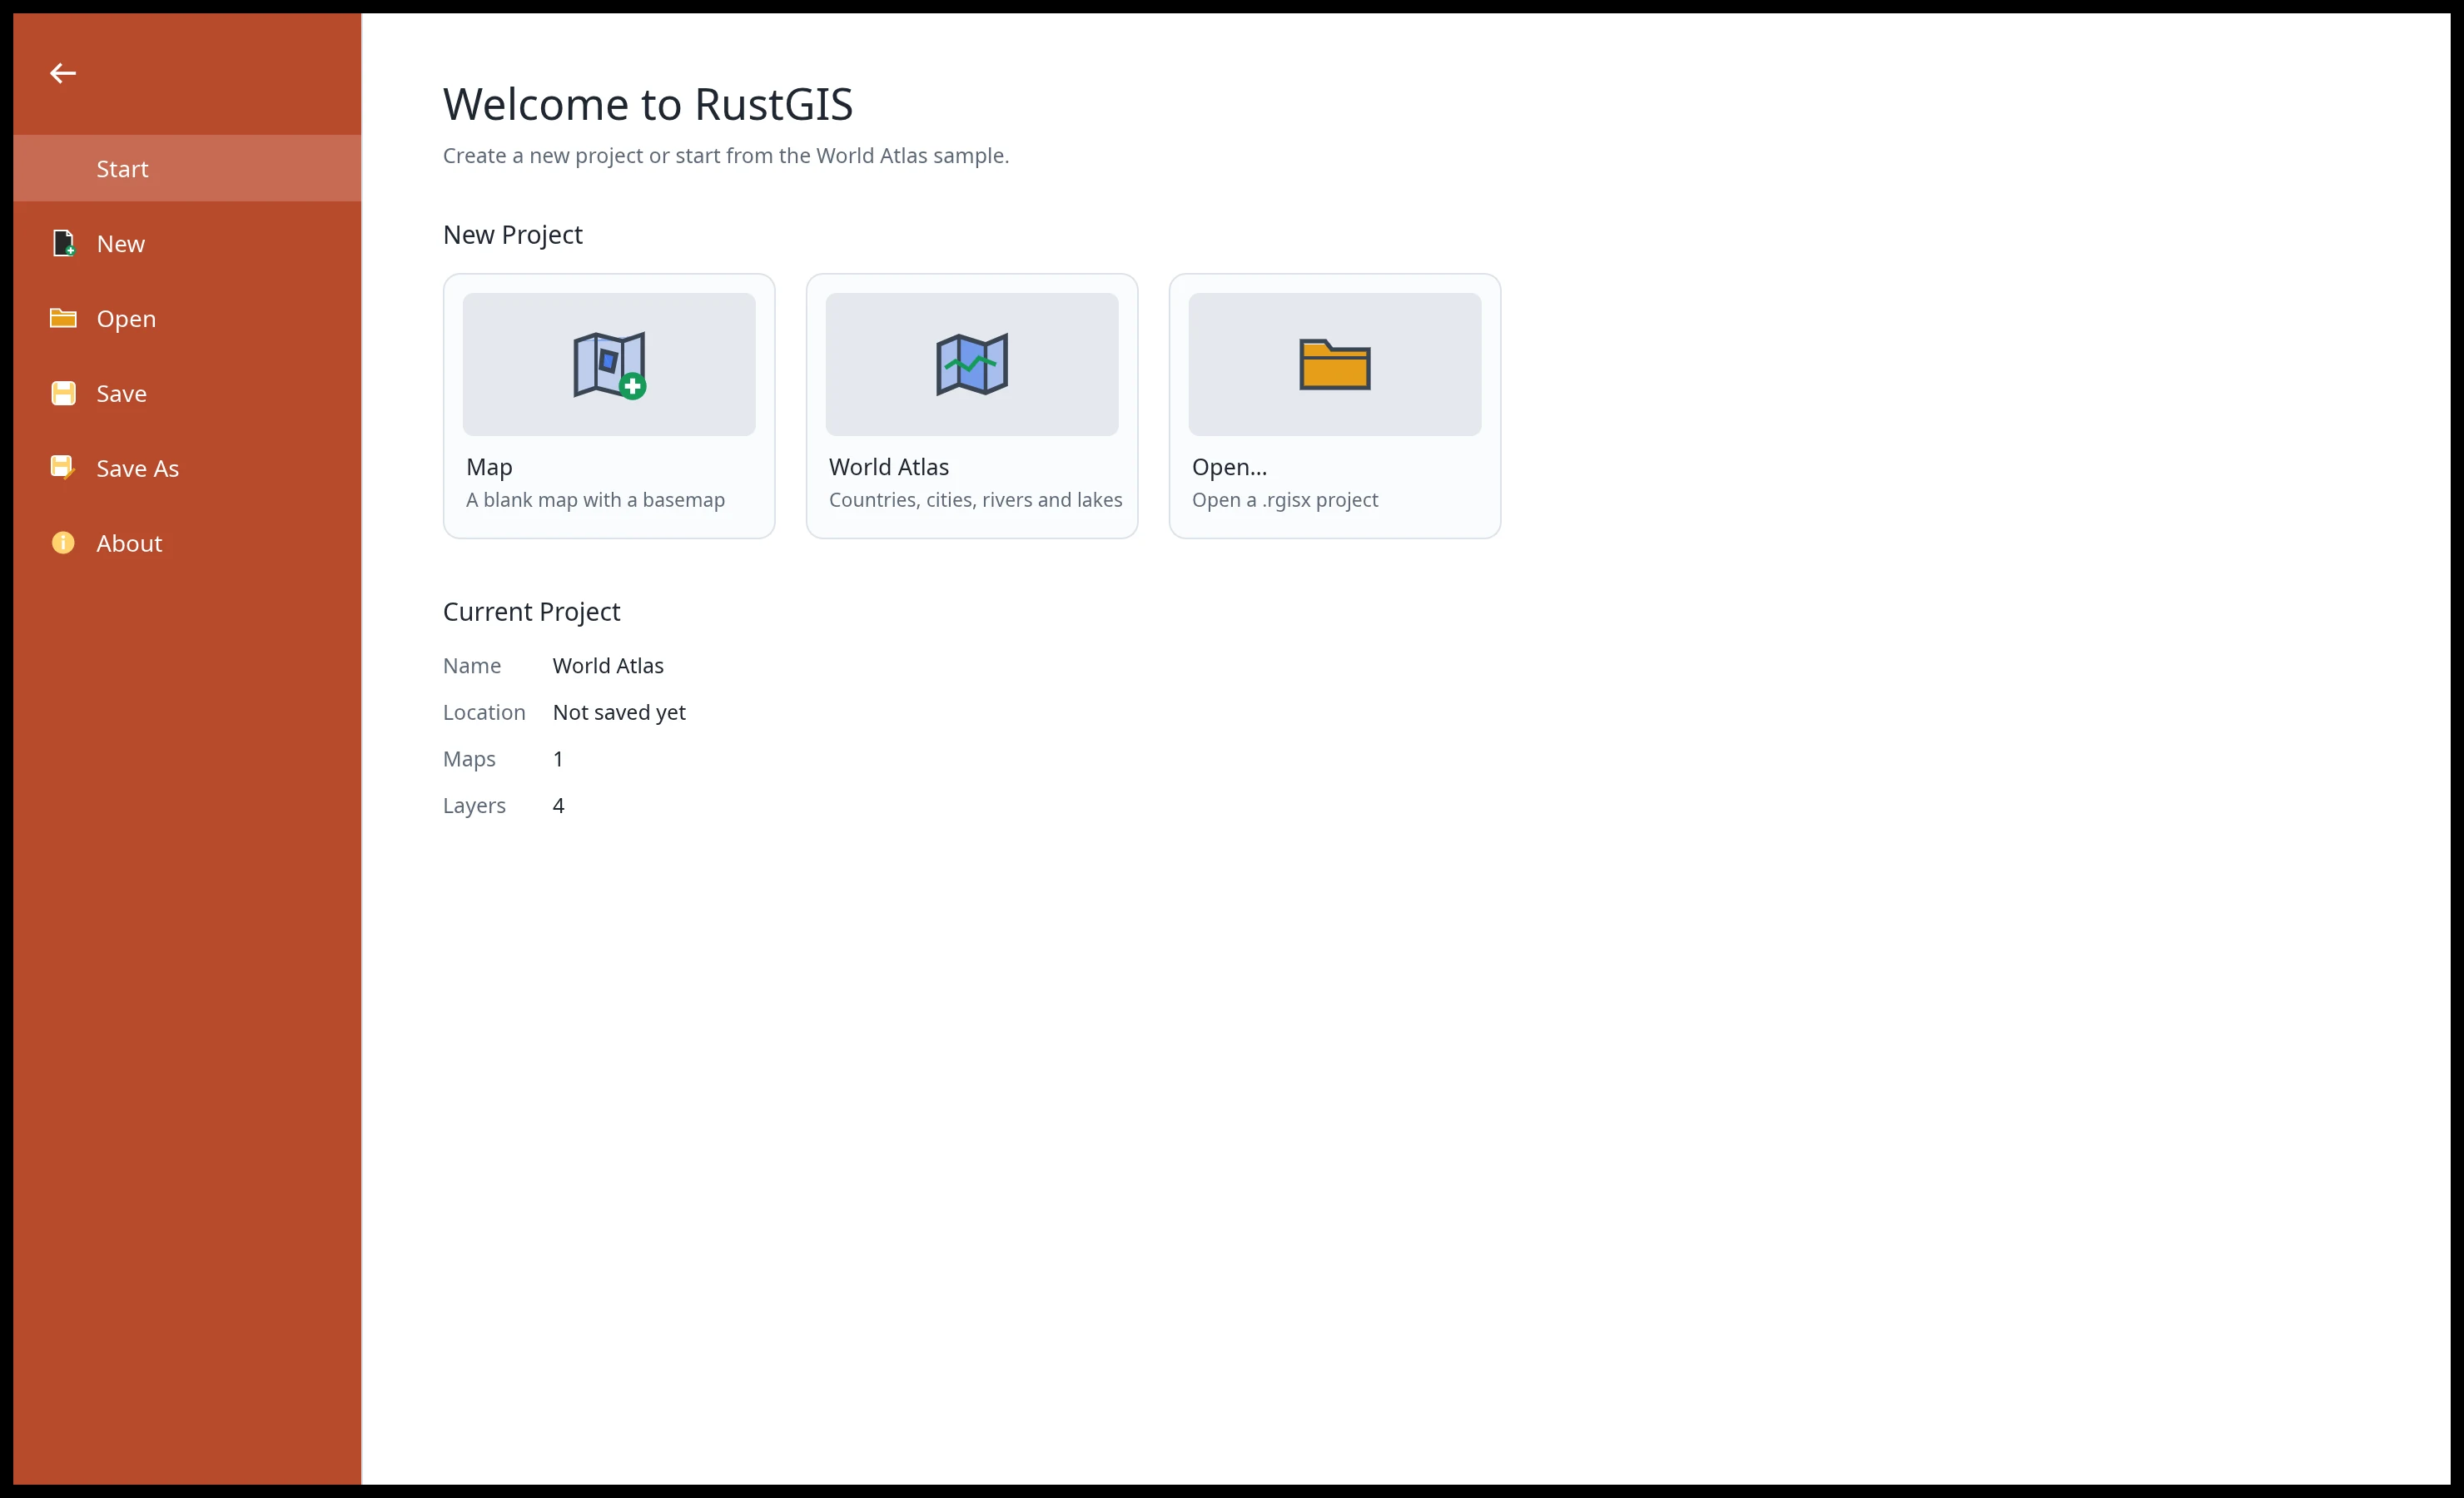 Projects. Start blank, from the World Atlas sample, or open a project. |
Every screenshot is RustGIS itself, rendered offscreen by `cargo run -p rustgis-ui-egui --example ui_shot`.
## Features
| Area | Highlights |
|---|---|
| **Data** | GeoJSON, CSV/TSV with x/y columns in other coordinate systems or WKT geometry, Excel and OpenDocument spreadsheets, GeoRSS, LandXML, encoded polylines, Shapefile (zipped too, in the browser as well), GeoPackage, GeoParquet, FlatGeobuf, KML/KMZ (with styles), GPX, GML, MapInfo MIF/MID, OpenStreetMap PBF, TopoJSON, CityJSON, AutoCAD DXF, LiDAR point clouds (LAS, LAZ, COPC) and geotagged photos (large GeoPackage, GeoParquet and FlatGeobuf files, and Shapefiles on the desktop, are read in place), files by their web address, every vector format GDAL reads when it is installed (desktop), Esri File Geodatabases without GDAL (desktop), PostGIS, MySQL, MariaDB and SQL Server tables read live (desktop), and SQL queries and DuckDB databases through DuckDB Spatial when DuckDB is installed (desktop); PMTiles archives (by web address, or a file on the desktop) and MBTiles files; GeoJSON, CSV, GeoPackage (also as a table added to an existing file), GeoParquet, Shapefile, FlatGeobuf, KML/KMZ, GPX and WKT out (GeoPackage and FlatGeobuf not from the web app); standalone tables; reusable connections; Reload Data for linked files (desktop); geocoding (Find Place, address tables); a Data Sources pane (favourites, recent, saved services, a library) and an SQL pane (desktop); supported QGIS and GeoLibre projects and layer styles; layer and map files, styles, templates and packages |
| **Open data** | STAC search (Planetary Computer assets), NASA Earthdata imagery and granule search (GeoTIFFs added on the desktop), Hugging Face, Overture Maps, Source Cooperative, OpenStreetMap by area, geoBoundaries, CKAN, Socrata and ArcGIS Hub portals; S3 buckets with signed connections and a bucket browser; a Data Cubes pane with a catalog of cubes for the time slider (added on the desktop) |
| **Rasters** | GeoTIFF and cloud-optimised GeoTIFF (any pixel type, tiled or striped, compressed), ASCII grids, Zarr 2 and 3 stores (a variable at a time step, by web address, or folder on the desktop), and JPEG 2000, NetCDF, HDF, ERDAS Imagine and the other rasters GDAL reads when it is installed (desktop); reprojection by EPSG code; Stretch, RGB, Classify, Unique Values, Colormap and Shaded Relief; DRA, band combinations, brightness/contrast/gamma; raster functions, indices, change detection, classification, georeferencing; cloud-optimised GeoTIFF export (desktop); data cubes, point time-series charts (desktop), temporal summaries and trends (Sen's slope, Mann–Kendall); a spectral profile comparing a multiband raster's bands at points |
| **Maps** | Multiple maps and layouts per project, renamed and duplicated from the Browser pane; a GPU renderer (beta) with smooth zoom and pan; tilt, rotation, terrain and a 3D globe; maps of the Moon, Mars and other celestial bodies; Web Mercator or another projection (Equal Earth, Robinson, Winkel Tripel, polar and regional presets, or a [supported](docs/user-guide/maps.md#projections) projected EPSG or ESRI code); a search box for layers, places and coordinates; UTM and MGRS readouts; an on-map right-click menu (copy the coordinate, quick buffer, viewshed and line of sight); identify pop-ups with links and pictures; bookmarks, extent history, coordinate navigation; five offline basemaps, with borders in 32 worldviews (31 downloaded when chosen) |
| **Web services** | WMS, WMTS, WFS, WCS, OGC API Features and Tiles, and ArcGIS REST (FeatureServer, MapServer, ImageServer, VectorTileServer) from their capabilities; CSW catalogue search; sign-in to ArcGIS Online and Enterprise, basic-auth and API-key logins; WMS and WMTS time on the time slider, legends and GetFeatureInfo |
| **Web tiles** | XYZ/TMS/WMS raster tiles, Mapbox Vector Tiles and MapLibre styles (sprites, patterns, expressions), cached and fetched in the background |
| **Cartography** | Single symbol, unique values (also by expression), graduated colours with seven classification methods and manual breaks, proportional symbols, pie and bar diagrams; symbol size, colour, width and angle, and label text, size, colour and angle, by expression; label classes with SQL queries, straight and curved line placement, installed font families (desktop), scale ranges and annotation; stacked and dashed line strokes, hatch, marker, gradient and shapeburst fills, custom colour ramps and the matplotlib colour maps, symbol levels, reference scales and polygons without fill; masking, display filters, aggregation bins, 2.5D extrusion; graphics and dynamic text |
| **Editing** | Create, move, rotate, scale, merge, split and explode features; vertex editing, cut polygons, reshape and trace along an edge; coincident polygon vertices in a layer moved together with Shared Vertices turned on; snapping, templates, elevation, traverse, topology rules; domains, subtypes, attribute rules, contingent values, relationships, archiving; Calculate Field with an expression language and Calculate Geometry in metric or imperial units, from the attribute table; edits saved back to GeoPackage and PostGIS tables (desktop); undo for everything in the project (undoing a save doesn't reverse what was written to the table) |
| **Analysis** | Selection by attributes (SQL) and location; Buffer, Near, Clip, Erase, Split, Intersect, Identity, Union, Symmetrical Difference, Update, Summarize Within, Summary Statistics, Pivot Table, Tabulate Intersection, Spatial Join, Zonal Statistics, Kernel Density, A5 grids; viewshed, line of sight, IDW, ordinary kriging, shortest path, suitability modelling; tools in the background on the desktop with progress and Cancel, many on several cores, and in batches; ModelBuilder on a node canvas, scripts with command, parameter and value completion, and history copied as code; 1,000+ [GeoLibre](https://github.com/opengeos/geolibre-rust) and Whitebox raster, vector, LiDAR, hydrology and terrain tools |
| **Data management** | Dissolve, Merge and Join Field; geometry conversions (feature to point, feature vertices to points, points along lines, polygon to line, split line at vertices, unsplit line, feature envelope to polygon, XY table to point) and minimum bounding geometry; check and repair geometry |
| **Imagery** | Ortho and reality mapping, pixel classification (k-means, minimum distance, a trainable neural network), mensuration, hosted imagery tiles |
| **Layouts and reports** | Page layouts with map frames, legends, scale bars, grids and map series; publication sheets and figures in one command, format panes, guides, snapping and element locks; reports with groups, statistics, charts and subreports; vector PDF and SVG, and GeoPDF with [supported map frames](docs/user-guide/layouts.md#layouts) georeferenced; presentations (HTML slideshow, PDF); notebooks (Jupyter in and out) |
| **Sharing** | PNG export at up to 600 DPI; PDF; web map pages, OGC API Features collections, MapLibre styles, glTF and STL scenes, vector and raster PMTiles, the map view as a GeoTIFF placed on the ground (desktop), locators; the web app embedded in a page (`?embed`); project, map and mobile map packages; offline areas with sync |
| **AI Assistant** | Ask about your data or tell the map what to do in plain language, with Anthropic, OpenAI (a key, or your ChatGPT plan by signing in on the desktop or command line), Gemini, OpenRouter, Requesty, TrustedRouter, Opper, UberLLM, Ollama or any OpenAI-compatible model; also `rustgis-cli ask`, and an [MCP server](docs/mcp.md) (`rustgis-cli mcp`) for Claude Code, Cursor, VS Code and other agents; skills; on the desktop, agents such as Claude Code and Codex started from the app, and external AI clients driving the open app; keys optionally remembered in the system keychain on the desktop (in the web app, unencrypted in the browser's storage) |
| **Plugins** | Sandboxed WebAssembly [plugins](docs/plugins.md) add commands, tools and ribbon tabs; install them from [plugins.rustgis.app](https://plugins.rustgis.app) on the desktop, command line and web. Process plugins (desktop and command line) run as programs (with Python environments RustGIS makes), in the background or for the whole session; panels offer trees, dropdowns, date pickers and sliders |
| **Python** | The [`rustgis` package](docs/python.md) on PyPI: the engine in-process, `rustgis.Map` in Jupyter and `rustgis.qt.MapWidget` in Qt applications |
| **Interface** | Layers, Browser and Data Sources panes as tabs, command search (Ctrl+K), keyboard shortcuts, dark mode, custom themes (desktop) and an interface scale, a customizable ribbon and Quick Access Toolbar, linked side-by-side maps, a History pane of tool runs and the session log, autosave and crash recovery (desktop), Check for Updates (desktop), 21 languages |
_(desktop)_ marks what the web app doesn't do; most of these also work from the command line and
Python.
The [user guide](https://rustgis.app/user-guide/) covers each area in detail,
[Comparison](https://rustgis.app/comparison/) sets RustGIS beside GeoLibre, QGIS and ArcGIS, and
[ROADMAP.md](ROADMAP.md) lists what's next.
## Get RustGIS
- **Web app**: open **[web.rustgis.app](https://web.rustgis.app)**. The same ribbon and tools,
with the browser's file picker for data and projects, and downloads for Save and Export.
- **Desktop**: download the app for Windows, macOS or Linux from
[downloads.rustgis.app](https://downloads.rustgis.app) or the
[latest release](https://github.com/opengeos/RustGIS/releases/latest) (see
[Installation](docs/installation.md) for the files and first-run notes).
- **Microsoft Store**: get RustGIS from the
[Microsoft Store](https://apps.microsoft.com/detail/9ppjw8h561lq) on Windows 10 and 11, which
installs it in one click and keeps it up to date.
- **Package managers**: `winget install OpenGeos.RustGIS`,
`brew install --cask rustgis` (macOS and Linux), `yay -S rustgis-bin` (AUR), or
`sudo dnf copr enable giswqs/rustgis && sudo dnf install rustgis` (Fedora).
- **From source**: `cargo run --release -p rustgis` (Rust 1.90 or later).
## Quick start
```sh
cargo run --release -p rustgis # the desktop app with the World Atlas sample
cargo run --release -p rustgis -- data.geojson # open data (or a .rgis project)
```
Command line: every ribbon action is a command with an id.
```sh
rustgis-cli commands # all command ids and parameters
rustgis-cli render countries.geojson map.png --basemap ocean
rustgis-cli run --sample \
--cmd 'gp.run={"tool":"countPoints","params":{"polygons":"Countries","points":"Cities"}}' \
--cmd 'layer.symbology={"layer":"Countries_Summarize","type":"graduated","field":"point_count"}' \
--cmd 'share.exportMap={"path":"out.png","dpi":192}' --save atlas.rgis
rustgis-cli ask --sample "Which 5 countries have the largest GDP?"
claude mcp add rustgis -- rustgis-cli mcp --sample # RustGIS as an MCP server for AI agents
```
See [Command Line](docs/cli.md) for more.
Python: the same engine and commands in-process (`pip install rustgis`), and the app itself in a
Jupyter notebook.
```python
import rustgis
s = rustgis.Session(sample=True)
s.run("gp.run", tool="buffer", params={"input": "Cities", "distance": 100})
s.to_png("map.png")
gdf = s.layer("Cities_Buffer").to_geopandas()
```
See [Python](docs/python.md) and the [getting-started notebook](apps/rustgis-python/examples/getting-started.ipynb)
([open in Colab](https://colab.research.google.com/github/opengeos/RustGIS/blob/main/apps/rustgis-python/examples/getting-started.ipynb)).
## Architecture
Layered crates, each depending only on the ones below it:
| Layer | Crate | Job |
|---|---|---|
| L0 | `rustgis-geom` | coordinates, extents, Web Mercator, geodesic distance/area, scale |
| L1 | `rustgis-data` | features and typed attributes; GeoJSON, CSV, Shapefile, KML, GPX and more; GeoPackage, GeoParquet, FlatGeobuf, LiDAR, PostGIS and MySQL providers; GDAL formats and DuckDB queries through their programs; SQL where clauses; rasters (GeoTIFF, ASCII grid, Zarr) and their coordinate systems |
| L2 | `rustgis-map`, `rustgis-analysis` | layers, symbology, labeling, camera, basemaps; geoprocessing (on `geo`) |
| L2 | `rustgis-tiles` | web map tiles: XYZ/TMS/WMS, Mapbox Vector Tiles, PMTiles and MBTiles archives, MapLibre styles, the tile cache |
| L3 | `rustgis-render` | tiny-skia renderer, label placement, PNG export, fonts |
| L3 | `rustgis-plugins` | sandboxed WebAssembly plugins and the plugin registry |
| L3 | `rustgis-geolibre` | the GeoLibre tool suite as geoprocessing tools |
| L4 | `rustgis-engine` | session, undo, command registry, sample project |
| L5 | `rustgis-assistant` | the AI Assistant: a chat agent that acts through commands |
| L6 | `rustgis-ui-egui` | the ribbon front end (swappable) |
| apps | `rustgis`, `rustgis-cli`, `rustgis-web`, `rustgis-python` | desktop, command line, browser (WebAssembly), the `rustgis` Python package |
`cargo xtask ci` runs formatting, clippy, the tests and the layering check. Contributor and
agent notes: [AGENTS.md](AGENTS.md).
## Sponsor
RustGIS is free and open source, and stays that way. If it is useful to you or your team, sponsorship is the most direct way to keep development, hosting and cross-platform distribution going.
- [**GitHub Sponsors**](https://github.com/sponsors/giswqs): monthly or one-time, billed through your GitHub account.
- [**Buy Me a Coffee**](https://buymeacoffee.com/giswqs): a quick one-off contribution, no account required.
See the [Become a Sponsor](https://rustgis.app/sponsor/) page for what sponsorship supports and for other, free ways to help.
## Citation
If you use RustGIS in your work, please cite it. RustGIS is archived on [Zenodo](https://zenodo.org/), which mints a DOI for every release. The concept DOI below always resolves to the latest version.
[](https://doi.org/10.5281/zenodo.23633281)
> Wu, Q., Rincón Albarracín, J. G., Filho, E., Hofbauer, D., Fitzgerald, M., & Strebel, D. (2026). RustGIS: A fast, free and open-source GIS in pure Rust for mapping, analyzing and sharing geospatial data. Zenodo.